Python | Bar Charts in Vincent
Last Updated :
02 Aug, 2019
In this article, we will create bar charts with the help for vincent. Which is a library in python which does python to vega translation? It has the data capabilities of python and the visualization capabilities of javascript. It is built specifically for plotting Dataframes and series quickly.
Requirement : install vincent
$pip install vincent
warning : requires Pandas which requires numpy
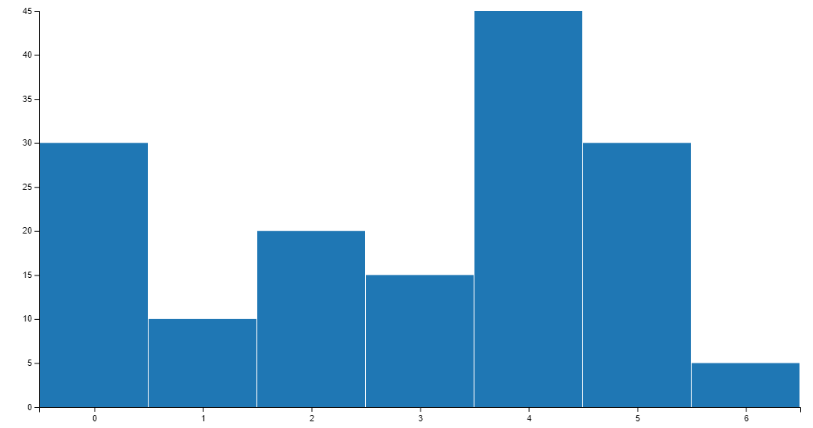
Example 1: Simple bar chart
import vincent
vincent.core.initialize_notebook()
bar = vincent.Bar([30, 10, 20, 15, 45, 30, 5])
bar.display()
|
Output :
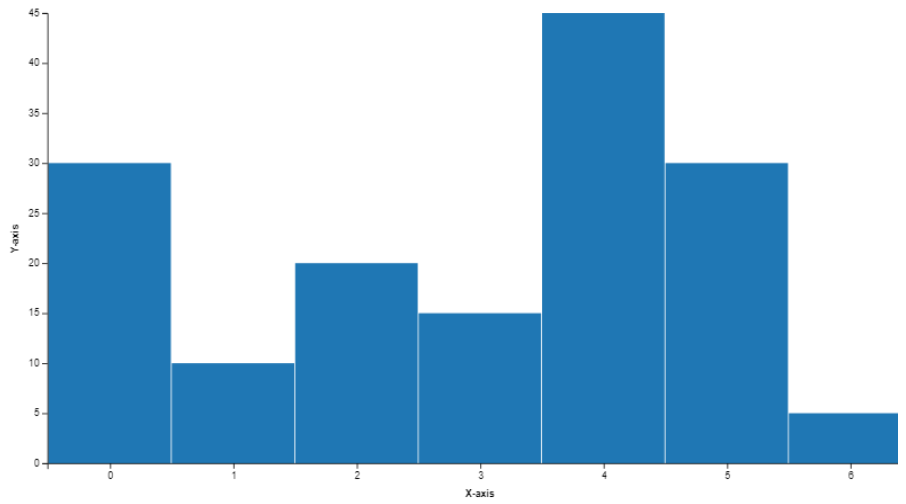
Example 2: Bar chart with axis labels
import vincent
vincent.core.initialize_notebook()
bar = vincent.Bar([30, 10, 20, 15, 45, 30, 5])
bar.axis_titles(x ='X-axis', y ='Y-axis')
bar.display()
|
Output :
For more information on vincent bar charts and vincent visit this link
Like Article
Suggest improvement
Share your thoughts in the comments
Please Login to comment...