Python Altair – Scatter Plot
Last Updated :
31 Jul, 2021
In this article, we will learn a Simple Scatter plot with Altair using python. Altair is one of the latest interactive data visualizations library in python. Altair is based on vega and vegalite– A grammar of interactive graphics. Here we will import the Altair library for using it. And then we will load the Seattle weather data from vega_dataset.
Step-by-step Approach:
Python3
import altair as alt
from vega_datasets import data
|
- Assign dataset and convert it into a data frame.
Python3
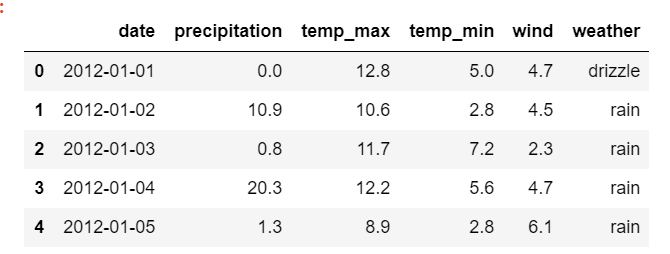
seattle_weather = data.seattle_weather()
|
Output:
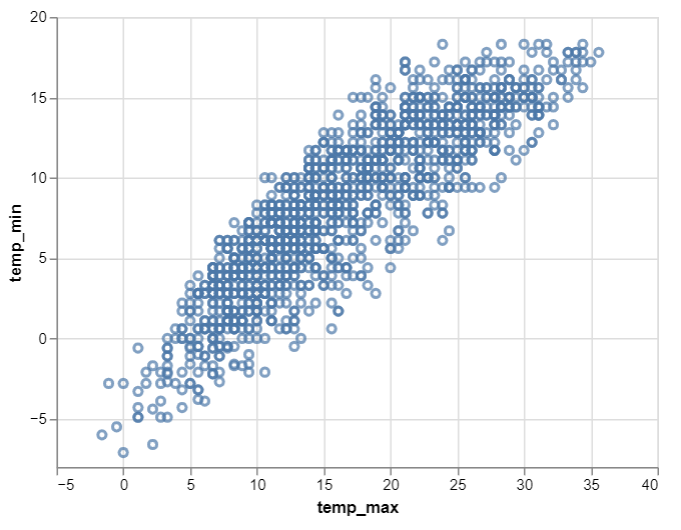
- Now let us make the scatter plot using Altair library. For this, we use Chart() function in Altair to load the data and then use the mark_point() function to make a scatter plot. We then use the aesthetics x and y-axis to encode() function. Hence, we get the simple scatter plot of two variable as shown below:
Python3
alt.Chart(seattle_weather).mark_point().encode(
x='temp_max',
y='temp_min'
)
|
Output:
Below is the complete program based on the above approach:
Python3
import altair as alt
from vega_datasets import data
seattle_weather = data.seattle_weather()
seattle_weather.head(5)
alt.Chart(seattle_weather).mark_point().encode(
x='temp_max',
y='temp_min'
)
|
Output:
Like Article
Suggest improvement
Share your thoughts in the comments
Please Login to comment...