PyCairo- Drawing Function curve
Last Updated :
18 Apr, 2023
In this article we will learn how we can draw a simple function curve using PyCairo in python. n mathematics, the graph of a function f is the set of ordered pairs, where f(x) = y. In the common case where x and f(x) are real numbers, these pairs are Cartesian coordinates of points in two-dimensional space.
PyCairo : Pycairo is a Python module providing bindings for the cairo graphics library.This library is used for creating SVG i.e vector files in python. The easiest and quickest way to open an SVG file to view it (read only) is with a modern web browser like Chrome, Firefox, Edge, or Internet Explorer—nearly all of them should provide some sort of rendering support for the SVG format.
SVG file is a graphics file that uses a two-dimensional vector graphic format created by the World Wide Web Consortium (W3C). It describes images using a text format that is based on XML. SVG files are developed as a standard format for displaying vector graphics on the web.
Steps of Implementation :
- Import the Pycairo & Math module.
- Create a SVG surface object and add context to it.
- Creating list for creating points for functional curve
- Traversing and plotting Points
- Setting color of the context & line width
Below is the Implementation :
Python3
import cairo
import math
x = 0
points = []
while x < 5:
y = math.sin(10*x)*math.exp(-x/2)
points.append((x*100 + 50, y*100 + 200))
x += 0.01
with cairo.SVGSurface("geek95.svg", 700, 700) as surface:
context = cairo.Context(surface)
context.move_to(*points[0])
for p in points[1:]:
context.line_to(*p)
context.set_line_width(2)
context.set_source_rgb(0.2, 1, 0.2)
context.stroke()
print("File Saved")
|
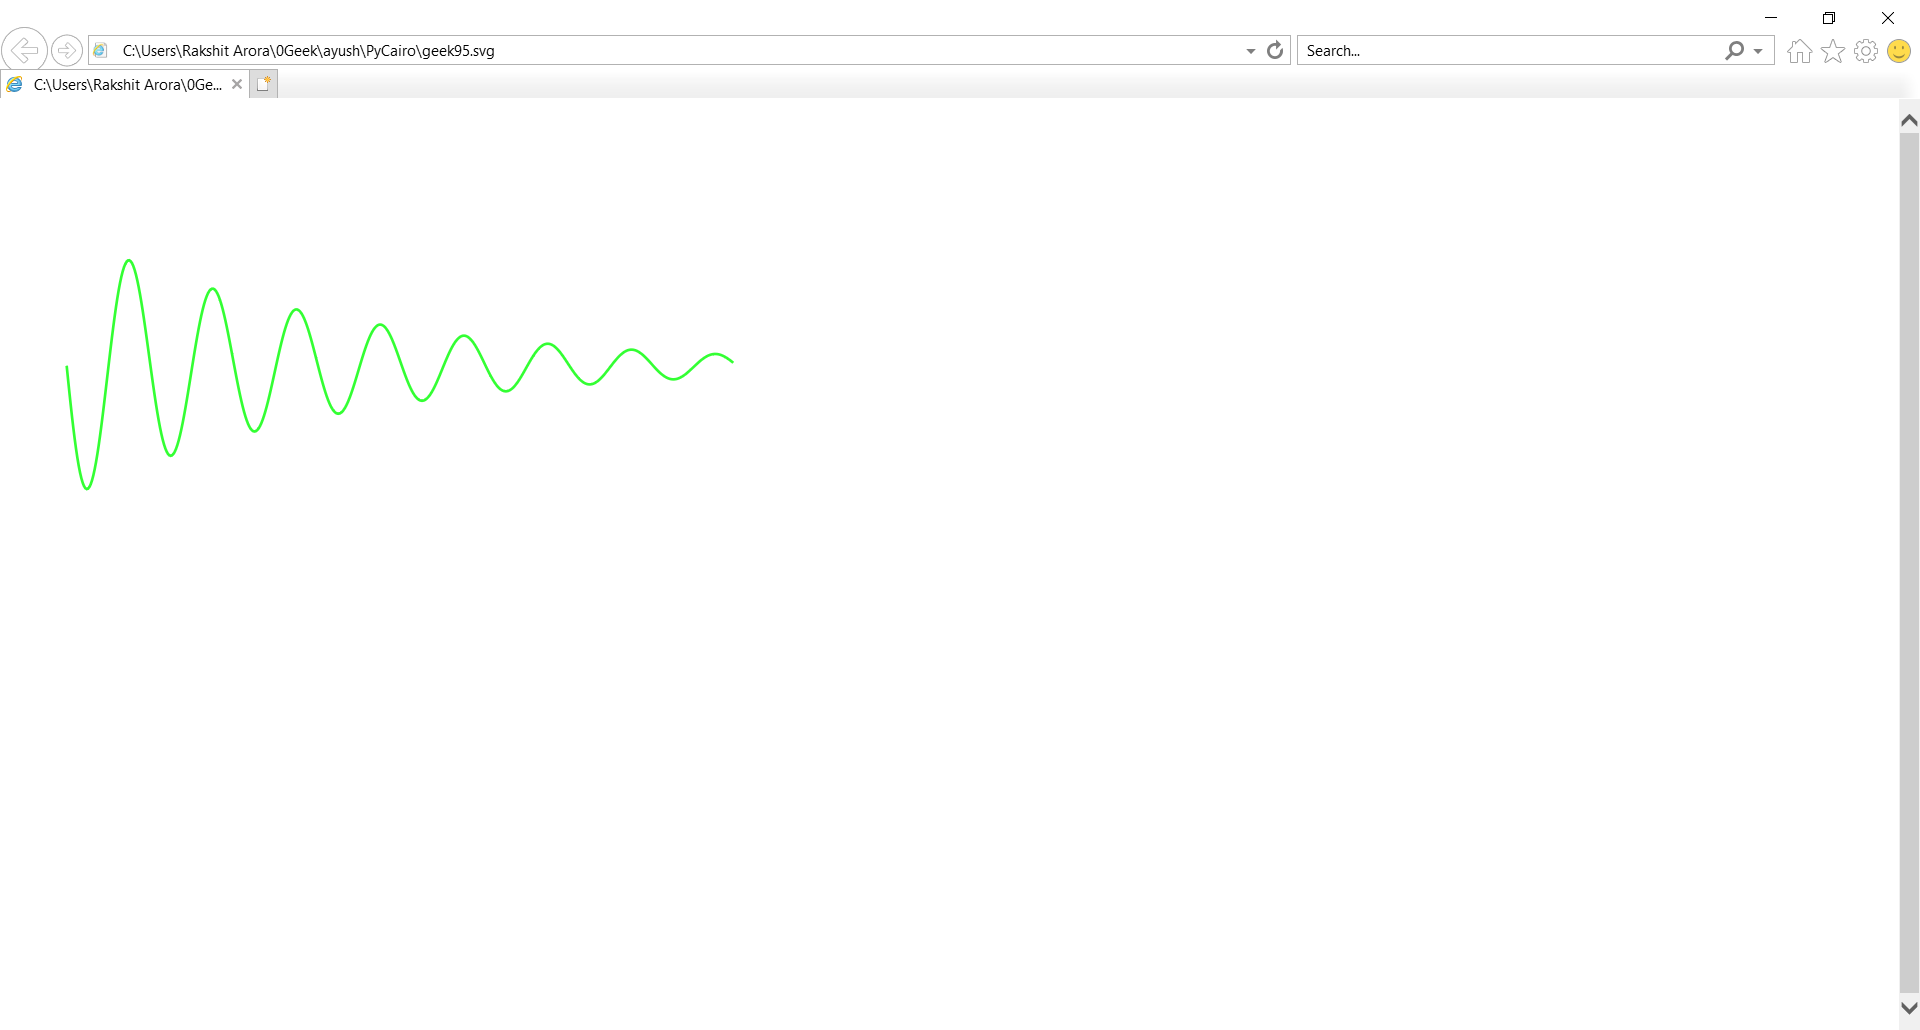
Output :
Like Article
Suggest improvement
Share your thoughts in the comments
Please Login to comment...