Projection Perspective in Machine Learning
Last Updated :
28 Feb, 2023
Before getting into projection perspective, let us first understand a technique known as PCA, what is the need for it and where it is used.
Principal Component Analysis:
It is an adaptive data analysis technique used for reducing the dimensionality of large datasets, increasing interpretability while minimizing information and reconstruction losses. In machine learning terms, it is used to reduce the number of parameters (regressors) based on how much they contribute to predicting the output so that they can be represented graphically in a 2D/3D plot. Let us consider the following regression model with 5 input parameters.

where,
y -> output (dependent variable).
x1, ..., x5 -> input parameters / regressors (independent variable).
w1, ..., w5 -> weights assigned to the input parameters.
It is not possible to represent this model graphically as there is 5 variable, but we can only plot data up to 3 dimensions. Therefore, we use PCA which takes in an input n where n represents the n most important regressors that contribute to finding the output y. Say n = 2, then we will get 2 new parameters that will best determine the output y is the equation now will be:

It is really easy to represent data in 2 dimensions.
Projection Perspective
It is a technique used in PCA that further minimizes the data reconstruction cost. Data reconstruction simply means reducing the data point in higher dimensions to lower dimensions where it is easily interpretable. In this method, we will focus on the difference between the original data vector xi and the reconstructed data vector xi‘. For this, we find a subspace (line) that minimizes the difference vector between the original data point and its projection as shown in Fig 1.
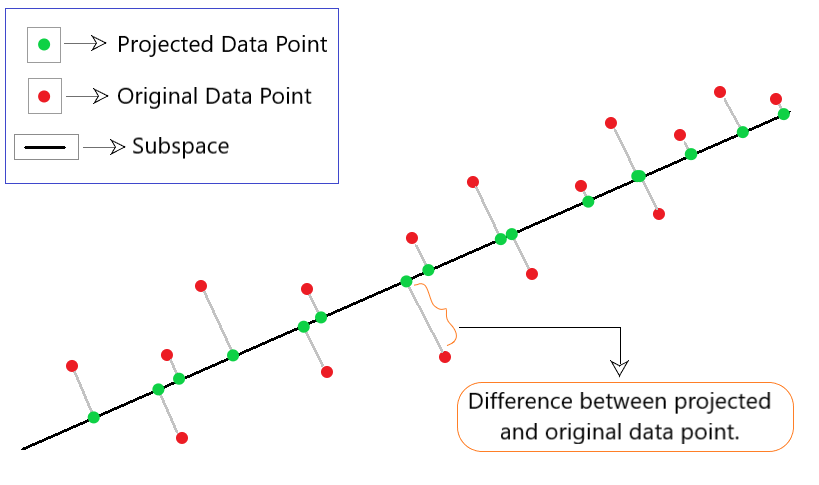
Fig 1: Illustration of the projection approach
Linear Independence
It states that there will always be a set of vectors with which we can represent every vector in the vector space by adding them together and scaling them. This set of vectors is called the basis. Generally, we can add vectors together and multiply them with scalars as shown in the equation given below:

where,
V -> vector space
v -> formed vector
x1...i -> original vector
λ1...i -> scalar values
Intuition
Consider an orthogonal basis, B = (b1, . . . , bN).
Orthogonal Basis implies biTbj = 1 if (i = j) and 0 otherwise.
As per the concept of linear independence, basis B can be defined as a linear combination of the basis vectors. (equation given below)

where,
v -> linear combination of basis vector existing in the higher dimension.
x -> suitable coordinates for v.
Now, we are interested in finding out a vector v’, that exists in the lower dimension U (called the principal subspace) where, dim(U) = I. We can find v’ by using the following equation:

where,
v' -> new vector existing in the lower dimensions.
y -> suitable coordinates for v'.
Assuming that coordinates yi and xi are not identical to each other.
Based on the above 2 equations, we ensure that the vector v’ found in the lower dimension is as similar as possible to the vector v in the higher dimension.
Now, the objective is to minimize the difference between the vector present in the higher and lower dimension (or minimizing the reconstruction error). To measure the similarity between vectors v and v’, we find the squared Euclidean distance (also known as Reconstruction error) between them using the following equation:

Consider the image given below:
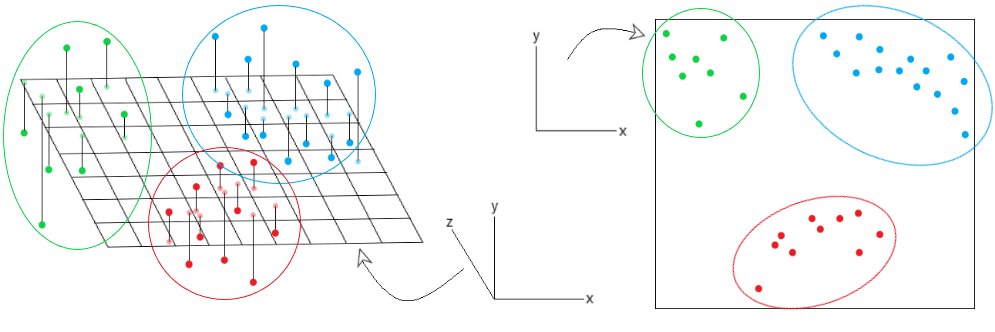
On observing the graph on the left, we have mapped the projections of data points on the 3D plane. However, we cannot easily segregate the data into distinct clusters as they may overlap with each other. Using a projection perspective in PCA, we can project the 3D data points onto a 2D plane. This way it becomes easier to interpret the data into distinct clusters. This is the big advantage of using different perspective methods like projection perspective in the PCA algorithm. For any doubt/query comment below.
Like Article
Suggest improvement
Share your thoughts in the comments
Please Login to comment...