Projected clustering in data analytics
Last Updated :
02 Nov, 2023
We already know about traditional clustering algorithms like k-means, DBSCAN, or hierarchical clustering that operate on all the dimensions of the data simultaneously. However, in high-dimensional data, clusters might only be present in a few dimensions, making the traditional clustering algorithms less effective. In this case, we use projected clustering.
What is Projected Clustering
Projected clustering, also known as subspace clustering, is a technique that is used to identify clusters in high-dimensional data by considering subsets of dimensions or projections of the data into lower dimensions. The projected clustering algorithm is based on the concept of k-medoid clustering, which was presented by Aggarwal (1999).
In projected clustering, the algorithm determines medoids for each cluster iteratively using a greedy hill-climbing technique. It starts by selecting medoids from a sample of the data and then iteratively upgrades the results. The quality of clusters in the projected clustering algorithm is typically measured on the average distance between data points and their closest medoid. This measure helps in determining how compact and separated the clusters are in the output.
The subspace dimensionality is an important input parameter in projected clustering. It determines the number of dimensions or projections considered for clustering. By selecting relevant subspaces or projections, the algorithm can discover clusters that might not be evident when considering all dimensions simultaneously. The choice of subspace dimensionality can influence the size and structure of the resulting clusters
Features of Projected Clustering :
- Projected clustering is a subspace clustering method that implements dimension reduction techniques. It begins by identifying an initial approximation of the clusters in the high-dimensional attribute space.
- Each dimension is then allocated a weight for each cluster and the renovated weights are used in the next repetition to restore the clusters. This leads to the inspection of dense regions in all subspaces of some craved dimensionality.
- It avoids the production of a huge number of overlapped clusters in lower dimensionality.
- Projected clustering finds the finest set of medoids by a hill climbing technique but generalized to deal with projected clustering.
- It works on a distance measure called Manhattan segmental distance.
- This algorithm is composed of three phases: Initialization, iteration, and cluster refinement.
- However, projected clustering is more speedy than CLIQUE due to the sampling of large datasets, though the use of a small number of illustrative points can cause this algorithm to miss out on some clusters completely.
- Experiments on projected clustering show that the procedure is structured and scalable for finding high-dimensional clusters. This algorithm finds non-overlapped partitions of points.
Steps Required in Projected Clustering
- Step 1 Data Reading and Preprocessing – At first we read data coming from different sources and apply preprocessing on it like filling missing values, standardizing the training data, and handling categorical columns.
- Step 2 Dimension Reduction – We will choose the subset of dimension in which we want to project our dataset using techniques like Principal Component Analysis (PCA) to project the high-dimensional data into a lower-dimensional space.
- Step 3 Clustering in subspace – We will apply traditional clustering algorithms like k-means to cluster our data from lower dimensional space.
- Step 4 Evaluating the clustering – At the end we will evaluate our clusters centroids and data points to check if the data points are clustered into the correct group.
Input and Output for Projected Clustering:
Input –
- The group of data points.
- A number of clusters, indicated by k.
- The average number of dimensions for each cluster is indicated by L.
Output –
- The clusters identified, and the dimensions esteemed to such clusters.
Python Implementation of Projected Clustering
For implementing projected clustering in Python with a dataset having 20 rows we will first. We will first apply PCA(principal component analysis) to reduce the dimension of the dataset from 20 rows to 2 rows. After reducing the dimension of the dataset we will apply the k-means clustering algorithm on the dataset to cluster the data points.
Python3
import numpy as np
from sklearn.decomposition import PCA
from sklearn.cluster import KMeans
import matplotlib.pyplot as plt
np.random.seed(0)
num_samples = 1000
num_dimensions = 20
data = np.random.randn(num_samples, num_dimensions)
num_selected_dimensions = 2
pca = PCA(n_components=num_selected_dimensions)
projected_data = pca.fit_transform(data)
num_clusters = 3
kmeans = KMeans(n_clusters=num_clusters, random_state=0)
kmeans.fit(projected_data)
cluster_labels = kmeans.labels_
plt.scatter(projected_data[:, 0], projected_data[:, 1], c=cluster_labels)
plt.title("Projected Clustering using K-means")
plt.xlabel("Dimension 1")
plt.ylabel("Dimension 2")
plt.show()
|
Output:
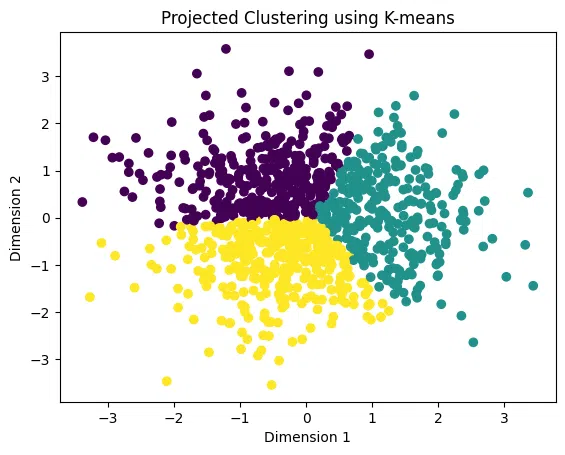
Projected clustering k-means
Like Article
Suggest improvement
Share your thoughts in the comments
Please Login to comment...