Predictive Analysis in R Programming
Last Updated :
01 Jun, 2020
Predictive analysis in R Language is a branch of analysis which uses statistics operations to analyze historical facts to make predict future events. It is a common term used in data mining and machine learning. Methods like time series analysis, non-linear least square, etc. are used in predictive analysis. Using predictive analytics can help many businesses as it finds out the relationship between the data collected and based on the relationship, the pattern is predicted. Thus, allowing businesses to create predictive intelligence.
In this article, we’ll discuss the process, need and applications of predictive analysis with example codes.
Process of Predictive Analysis
Predictive analysis consists of 7 processes as follows:
- Define project: Defining the project, scope, objectives and result.
- Data collection: Data is collected through data mining providing a complete view of customer interactions.
- Data Analysis: It is the process of cleaning, inspecting, transforming and modelling the data.
- Statistics: This process enables validating the assumptions and testing the statistical models.
- Modelling: Predictive models are generated using statistics and the most optimized model is used for the deployment.
- Deployment: The predictive model is deployed to automate the production of everyday decision-making results.
- Model monitoring: Keep monitoring the model to review performance which ensures expected results.
Need of Predictive Analysis
- Understanding customer behavior: Predictive analysis uses data mining feature which extracts attributes and behavior of customers. It also finds out the interests of the customers so that business can learn to represent those products which can increase the probability or likelihood of buying.
- Gain competition in the market: With predictive analysis, businesses or companies can make their way to grow fast and stand out as a competition to other businesses by finding out their weakness and strengths.
- Learn new opportunities to increase revenue: Companies can create new offers or discounts based on the pattern of the customers providing an increase in revenue.
- Find areas of weakening: Using these methods, companies can gain back their lost customers by finding out the past actions taken by the company which customers didn’t like.
Applications of Predictive Analysis
- Health care: Predictive analysis can be used to determine the history of patient and thus, determining the risks.
- Financial modelling: Financial modelling is another aspect where predictive analysis plays a major role in finding out the trending stocks helping the business in decision making process.
- Customer Relationship Management: Predictive analysis helps firms in creating marketing campaigns and customer services based on the analysis produced by the predictive algorithms.
- Risk Analysis: While forecasting the campaigns, predictive analysis can show an estimation of profit and helps in evaluating the risks too.
Example:
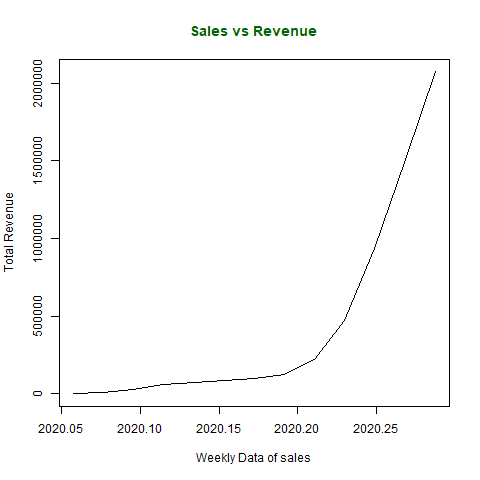
Let us take an example of time analysis series which is a method of predictive analysis in R programming:
x <- c(580, 7813, 28266, 59287, 75700,
87820, 95314, 126214, 218843, 471497,
936851, 1508725, 2072113)
library(lubridate)
png(file ="predictiveAnalysis.png")
mts <- ts(x, start = decimal_date(ymd("2020-01-22")),
frequency = 365.25 / 7)
plot(mts, xlab ="Weekly Data of sales",
ylab ="Total Revenue",
main ="Sales vs Revenue",
col.main ="darkgreen")
dev.off()
|
Output:
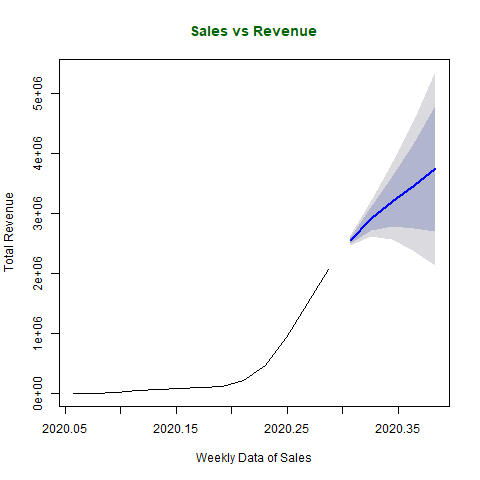
Forecasting Data:
Now, forecasting sales and revenue based on historical data.
x <- c(580, 7813, 28266, 59287, 75700,
87820, 95314, 126214, 218843,
471497, 936851, 1508725, 2072113)
library(lubridate)
library(forecast)
png(file ="forecastSalesRevenue.png")
mts <- ts(x, start = decimal_date(ymd("2020-01-22")),
frequency = 365.25 / 7)
fit <- auto.arima(mts)
forecast(fit, 5)
plot(forecast(fit, 5), xlab ="Weekly Data of Sales",
ylab ="Total Revenue",
main ="Sales vs Revenue", col.main ="darkgreen")
dev.off()
|
Output:
Like Article
Suggest improvement
Share your thoughts in the comments
Please Login to comment...