There are numerous ways to evaluate the performance of a classifier. In this article, we introduce the Precision-Recall Curve and further examine the difference between two popular performance reporting methods: Precision-Recall (PR) Curve and Receiver Operating Characteristic (ROC) Curve. ROC Curve is already discussed in the article. Let us briefly understand what is a Precision-Recall curve.
What is Precision and Recall?
Precision
- The ratio of correctly predicted positive observations to all predicted positives is known as precision.
- It gauges how well the model forecasts the positive outcomes.
- The precision formula is:
[Tex]Precision = \frac{True Positives}{True Positives + False Positives}
[/Tex]
- Precision is concerned with the quality of positive predictions. A high precision indicates that the model has a low rate of false positives.
Recall
- The ratio of correctly predicted positive observations to the total number of actual positive observations is known as recall.
- It gauges how well the model can capture each pertinent instance.
- Recall is calculated using this formula:
[Tex]Precision = \frac{True Positives}{True Positives + False Negatives}
[/Tex]
- Recall is concerned with the quantity of the relevant instances captured by the model. A high recall indicates that the model has a low rate of false negatives.
In terms of empirical interpretation, a confusion matrix comprising four essential terms is the most useful tool for comprehending precision and recall:
- True Positive (TP): The number of positive class instances that are accurately identified
- False Positive (FP): The number of negative class instances that are mistakenly identified as positive class instances is known as False Positive (FP).
- True Negative (TN): The number of negative class instances that are accurately identified
- False Negative (FN): Count of positive class instances that are mistakenly classified as negative class instances (False Negative, or FN)
Precision-Recall (PR) Curve in Machine Learning
Precision is the proportion of correct positive classifications (true positive) divided by the total number of predicted positive classifications that were made (true positive + false positive). Recall is the proportion of correct positive classifications (true positive) divided by the total number of the truly positive classifications (true positive + false negative).
A PR curve is simply a graph with Precision values on the y-axis and Recall values on the x-axis. In other words, the PR curve contains [Tex]\frac{TP}{TP+FP}
[/Tex] on the y-axis and [Tex]\frac{TP}{TP+FN}
[/Tex] on the x-axis.
- It is important to note that Precision is also called the Positive Predictive Value (PPV).
- The recall is also called Sensitivity, Hit Rate, or True Positive Rate (TPR).
The figure below shows a comparison of sample PR and ROC curves. 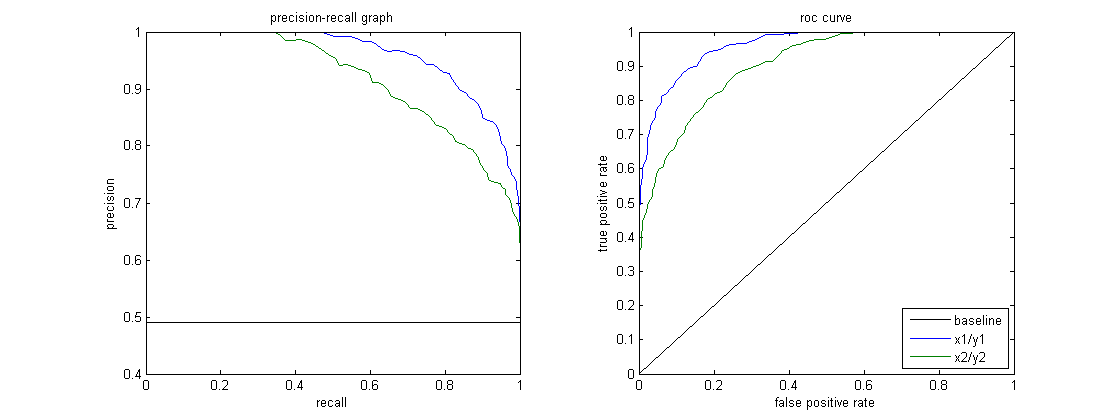
Interpreting a Precision-Recall Curve
It is desired that the algorithm should have both high precision and high recall. However, most machine learning algorithms often involve a trade-off between the two. A good PR curve has greater AUC (area under the curve). In the figure above, the classifier corresponding to the blue line has better performance than the classifier corresponding to the green line. It is important to note that the classifier that has a higher AUC on the ROC curve will always have a higher AUC on the PR curve as well. Consider an algorithm that classifies whether or not a document belongs to the category “Sports” news. Assume there are 12 documents, with the following ground truth (actual) and classifier output class labels.
| Document ID | Ground Truth | Classifier Output |
|---|
| D1 | Sports | Sports |
| D2 | Sports | Sports |
| D3 | Not Sports | Sports |
| D4 | Sports | Not Sports |
| D5 | Not Sports | Not Sports |
| D6 | Sports | Not Sports |
| D7 | Not Sports | Sports |
| D8 | Not Sports | Not Sports |
| D9 | Not Sports | Not Sports |
| D10 | Sports | Sports |
| D11 | Sports | Sports |
| D12 | Sports | Not Sports |
Now, let us find TP, TN, FP, and FN values.
Let’s use an example involving documents classified as “Sports” or “Not sports” to better explain the definitions of True Positives (TP), True Negatives (TN), False Positives (FP), and False Negatives (FN) in the context of classification:
True Positives (TP): Documents that were accurately categorised as “Sports” and that were in fact about sports. Documents D1, D2, D10, and D11 in this scenario are instances of TP.
True Negatives (TN): True Negatives are those cases in which the document was appropriately labelled as “Not sports” even though it had nothing to do with sports. In this instance, TN is demonstrated by documents D5, D8, and D9.
False Positives (FP): Documents that were mistakenly categorised as “Sports” even though they had nothing to do with sports. Here are some FP examples, documents D3 and D7.
False Negatives (FN): Examples of documents that were mistakenly labelled as “Not sports,” but in reality, they were about sports. Documents D4, D6, and D12 in this case are FN examples.
Given these counts: TP=4,TN=3,FP=2,FN=3
Finally, precision and recall are calculated as follows:
[Tex]Precision = \frac{TP}{TP+FP} = \frac{4}{6} = \frac{2}{3}
[/Tex]
[Tex]Recall = \frac{TP}{TP+FN} = \frac{4}{7}
[/Tex]
It follows that the recall is 4/7 when the precision is 2/3. Stated differently, of all the cases that were anticipated to be positive, two-thirds were accurately classified (precision), and of all the instances that were actually positive, the model was able to capture four-sevenths of them (recall).
By setting different thresholds, we get multiple such precision, recall pairs. By plotting multiple such P-R pairs with either value ranging from 0 to 1, we get a PR curve.
Need for a PR curve when the ROC curve exists?
PR curve is particularly useful in reporting Information Retrieval results.
Information Retrieval involves searching a pool of documents to find ones that are relevant to a particular user query. For instance, assume that the user enters a search query “Pink Elephants”. The search engine skims through millions of documents (using some optimized algorithms) to retrieve a handful of relevant documents. Hence, we can safely assume that the no. of relevant documents will be much less compared to the no. of non-relevant documents.
In this scenario,
- TP = No. of retrieved documents that are relevant (good results).
- FP = No. of retrieved documents that are non-relevant (bogus search results).
- TN = No. of non-retrieved documents that are non-relevant.
- FN = No. of non-retrieved documents that are relevant (good documents we missed).
ROC curve is a plot containing Recall = TPR = [Tex]\frac{TP}{TP+FN}[/Tex] on the x-axis and FPR = [Tex]\frac{FP}{FP+TN}[/Tex] on the y-axis. Since the no. of true negatives, i.e. non-retrieved documents that are non-relevant, is such a huge number, the FPR becomes insignificantly small.
Further, FPR does not help us evaluate a retrieval system well because we want to focus more on the retrieved documents, and not the non-retrieved ones. PR curve helps solve this issue. PR curve has the Recall value (TPR) on the x-axis, and precision = [Tex]\frac{TP}{TP+FP}[/Tex] on the y-axis. Precision helps highlight how relevant the retrieved results are, which is more important while judging an IR system. Hence, a PR curve is often more common around problems involving information retrieval.
When to Use ROC vs. Precision-Recall Curves?
ROC (Receiver Operating Characteristic) curves are suitable when the class distribution is balanced, and false positives and false negatives have similar consequences. They depict the trade-off between sensitivity and specificity. In contrast, Precision-Recall curves are preferable when dealing with imbalanced datasets, focusing on positive class prediction performance.
Precision-Recall provides insights into the model’s ability to correctly classify positive instances. Choosing between ROC and Precision-Recall depends on the specific needs of the problem, emphasizing the importance of understanding the data distribution and the consequences of different types of errors.
Basic Code Implementation for Precision-Recall Curve
Importing Necessary Libraries
These lines of code import the Python libraries and modules required to generate a precision-recall curve with sci-kit-learn and visualize the results with Matplotlib. Matplotlib is a popular Python plotting library, and pyplot provides a straightforward interface for creating various types of plots and charts. Logistic Regression is a popular classification algorithm for binary and multiclass classification tasks. The precision-recall curve and AUC are popular evaluation metrics for binary classification problems, particularly when dealing with imbalanced datasets.
Python3
                    import matplotlib.pyplot as plt
from sklearn.datasets import make_classification
from sklearn.model_selection import train_test_split
from sklearn.linear_model import LogisticRegression
from sklearn.metrics import precision_recall_curve, auc
Dataset Used
This code generates a synthetic dataset for a binary classification problem using sci-kit-learn’s ‘make_classification’ function.
Python3
                    # Generate a synthetic dataset
X, y = make_classification(
    n_samples=1000, n_features=20, n_classes=2, random_state=42)
Train and Test Split
The train_test_split function in scikit-learn is used in this code snippet to split the previously generated synthetic dataset (X and y) into training and testing sets. This split is a critical step in evaluating machine learning models. The model will be trained on the X_train and y_train data before being tested on the X_test and y_test data to see how well it performs on unseen samples. The train_test_split function separates training and testing sets, ensuring that the model’s performance reflects its generalization to new, previously unseen data.
Python3
                    # Split the dataset into training and testing sets
X_train, X_test, y_train, y_test = train_test_split(
    X, y, test_size=0.2, random_state=42)
Model Building
Here we are using logistic regression to train the model on the training data set. A popular algorithm for binary classification, logistic regression is implemented by the sci-kit-learn class LogisticRegression.
Python3
                    # Train a logistic regression model (you can replace this with your own classifier)
model = LogisticRegression()
model.fit(X_train, y_train)
Model Prediction
These computations usually give precision and recall values for various decision thresholds, which you can use to draw a precision-recall curve or examine the relative importance of precision and recall at various points in time. And calculating the Area Under the Curve (AUC) for the precision-recall curve.
Python3
                    # Predict probabilities for positive class
y_scores = model.predict_proba(X_test)[:, 1]
# Calculate precision and recall
precision, recall, thresholds = precision_recall_curve(y_test, y_scores)
# Calculate Area Under the Curve (AUC) for precision-recall curve
auc_score = auc(recall, precision)
Plotting PR Curve
This code block provides a standard method for visualizing the precision-recall curve and lets you evaluate the precision vs recall trade-off at various decision thresholds. The model’s overall performance on the precision-recall curve is summarised by the AUC score shown in the legend.
Python3
                    # Plot precision-recall curve
plt.figure(figsize=(8, 6))
plt.plot(recall, precision, label=f'Precision-Recall Curve (AUC = {auc_score:.2f})')
plt.xlabel('Recall')
plt.ylabel('Precision')
plt.title('Precision-Recall Curve')
plt.legend()
plt.show()
Output:
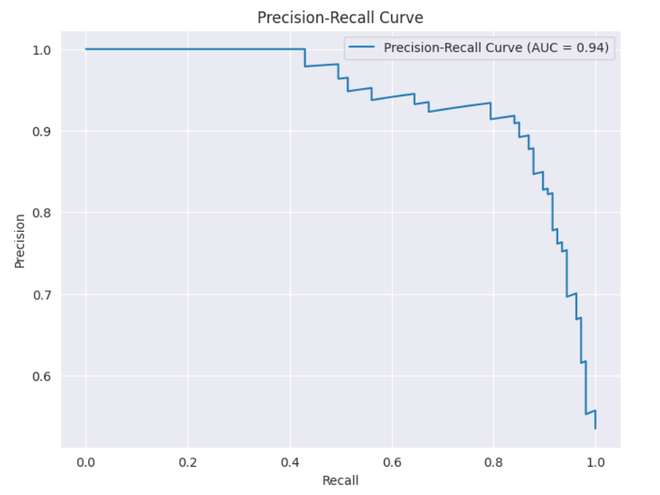
Precision-Recall Curve
Frequently Asked Questions (FAQs)
Q. What is Precision?
The ratio of accurately predicted positive observations to the total number of predicted positives is known as precision. It gauges how well the model predicts the positive outcomes. The following is the precision formula:
[Tex]Precision = \frac{True Positives}{True Positives + False Positives}
[/Tex]
Q. What is Recall?
Recall is the ratio of correctly predicted positive observations to the total number of actual positives. It is also referred to as sensitivity or true positive rate. It assesses how well the model can capture each pertinent instance. Recall is calculated using the following formula:
[Tex]Precision = \frac{True Positives}{True Positives + False Negatives}
[/Tex]
Q. Why do we need precision and recall?
To assess a classifier’s performance in binary and multiclass classification problems, two evaluation metrics are used: precision and recall. Positive prediction accuracy is measured by precision, and positive prediction completeness is measured by recall.
Q. What is the recall vs. precision trade-off?
Recall and precision are frequently trade-offs. Recall may suffer as precision rises, and vice versa. By changing the bar for identifying a positive instance, this trade-off can be managed. Conversely, a lower threshold results in lower recall but higher precision. The decision between recall and precision is based on the particulars of the given problem.
Q. What is the F1 score, and how does it relate to precision and recall?
The harmonic mean of recall and precision is known as the F1 score. It offers a fair measurement that takes into account both false positives and false negatives. The F1 score is calculated using the following formula:
[Tex]F1-Score = \frac{2\times Precision \times Recall}{Precision + Recall}
[/Tex]
The F1 score is especially useful when precision and recall are out of balance and a balance between the two is desired.
Like Article
Suggest improvement
Share your thoughts in the comments
Please Login to comment...