Precision, Recall and F1-Score using R
Last Updated :
25 Apr, 2023
Recall, also known as true positive rate (TPR), sensitivity, or hit rate, is a measure of the performance of a binary classification system. It is calculated as the ratio of true positive predictions (i.e., the number of times the model correctly predicted the positive class) to the total number of actual positive cases. In other words, recall is a measure of how well the model is able to identify all the positive cases.
In R Programming language, we can calculate recall using the confusionMatrix() function in the caret package. This function takes as input a matrix of predicted classes and a matrix of true classes and returns a variety of performance metrics, including recall.
But first, we need to install the caret package in RStudio.
R
install.packages("caret")
|
We type this command in the console and wait for a few minutes to let this package get installed. After installation, we can use this package.
R
predicted <- c(1, 1, 1, 0, 0)
actual <- c(1, 0, 1, 1, 1)
xtab <- table(predicted, actual)
library(caret)
cm <- caret::confusionMatrix(xtab)
cm
|
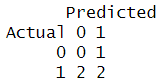
Output:
      Predicted
Actual 0 1
     0 0 1
     1 2 2

               Accuracy : 0.4
                 95% CI : (0.0527, 0.8534)
    No Information Rate : 0.8
    P-Value [Acc > NIR] : 0.9933

                  Kappa : -0.3636

 Mcnemar's Test P-Value : 1.0000

            Sensitivity : 0.0000
            Specificity : 0.5000
         Pos Pred Value : 0.0000
         Neg Pred Value : 0.6667
             Prevalence : 0.2000
         Detection Rate : 0.0000
   Detection Prevalence : 0.4000
      Balanced Accuracy : 0.2500

       'Positive' Class : 0
- True Negative (TN) – 0
- False Positive (FP) – 1
- False Negative (FN) – 2
- True Positive (TP) – 2
Now we can calculate Recall using its formula.
Calculating Recall by using the Mathematical formula
The recall is nothing but the ratio between Tru Positives and the sum of the True Positive and False Negative.
Recall = TP / (TP + FN)
Also, we can use another method to calculate recall, that is by using Metrics Package which has a ‘recall’ function to get the value. But first, we need to install the Metrics package in RStudio.
R
install.packages("Metrics")
|
We type this command in the console and wait for a few minutes to let this package get installed. After installation, we can use this package.
R
library(Metrics)
recall = recall(actual = c(1,0,1,1,0),
predicted = c(1,0,0,0,1))
print(recall)
|
Output:
0.3333333
In these two ways, we can calculate Recall for our machine-learning model. Let us now see about the F1 score.
Precision and F1 – Score
The F1-score is a measure of a model’s performance that combines precision and recall. It is defined as the harmonic mean of precision and recall, where the best value is 1 and the worst value is 0.
There is another metric named Precision. In R, precision is a measure of a model’s performance that tells you how many of the positive predictions made by the model are actually correct. It is calculated as the number of true positive predictions divided by the number of true positive and false positive predictions.
To compute precision and F1-score in R, we can use the caret package and the confusionMatrix() function. As we already have downloaded the caret package in RStudio we can directly implement this. Let us understand the precision and F1-score better with an example
R
predicted <- c(1, 1, 1, 0, 0)
actual <- c(1, 0, 1, 1, 1)
xtab <- table(predicted, actual)
library(caret)
cm <- caret::confusionMatrix(xtab)
cm
|
Output:
OUTPUT
Now we can calculate F1-Score and Precision using their formulas:
Precision = TP / (TP + FP)

F1 = 2 * (Precision * Recall) / (Precision + Recall)
R programming language provides us with another package called Metrics which has functions like precision(), f1_score(), etc. We can directly calculate these evaluation metrics without having to use any formulas. Let us understand this by an example:
R
library(Metrics)
predicted <- c(1, 1, 0, 1, 0, 0, 0, 0, 1, 1)
actual <- c(1, 0, 0, 1, 0, 0, 1, 1, 1, 1)
Metrics::recall(predicted, actual)
Metrics::precision(predicted, actual)
Metrics::f1(predicted, actual)
|
Output:
0.8
0.6666667
1
In this way, both these parameters are evaluated easily using the Metrics package.
Like Article
Suggest improvement
Share your thoughts in the comments
Please Login to comment...