Position ggplot text in Each Corner in R
Last Updated :
13 Sep, 2021
In this article, we will learn how to position ggplot2 text in each corner in the R Programming language.
To perform this task we will be using geom_text() function from ggplot library. We will be also be using reserved keywords in R which is Inf and -Inf. These are reserved keywords in the R programming language, and they store the value of Infinity and negative infinity. Inf stores the greatest value whereas -Inf stores the smallest value possible.
Syntax:
geom_text( data, aes(…), label()
First import required packages and prepare a list of text that will go to each corner. Also, prepare a list for all X coordinates and Y coordinates for data to be placed at each corner. Create a regular plot with some data. Now use geom_text() and pass the list so made as an argument and also the list of coordinates to correctly position them.
X, Y coordinate list contains the combination of Inf and -Inf, which helps in deciding the order of corners, for example (-Inf, -Inf) indicates bottom left, (Inf, Inf) indicates top right, etc. We use these values to determine the extreme corners.
In the text attribute, we provide the text which we want to plot. Note: here we have to provide the text data in the order in which we want it to be plotted in the corners. Then in x_adjust, y_adjust attribute, we provide the coordinates which we can use to adjust the positioning of the text in X and Y plane.
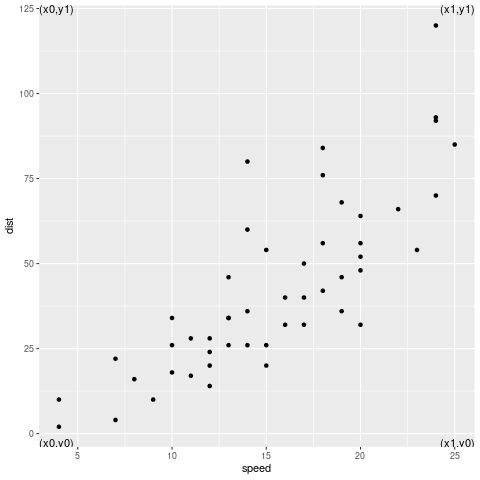
Example 1:
R
library(ggplot2)
annotations <- data.frame(
X = c(-Inf,-Inf,Inf,Inf),
Y = c(-Inf, Inf,-Inf,Inf),
text = c("(x0,y0)","(x0,y1)",
"(x1,y0)","(x1,y1)"),
x_adjust = c(0,0,1,1),
y_adjust = c(0,1,0,1))
ggplot(cars, aes(speed, dist)) + geom_point()+
geom_text(data=annotations, aes(
x=X,y=Y,hjust=x_adjust,vjust=y_adjust,label=text))
|
Output:
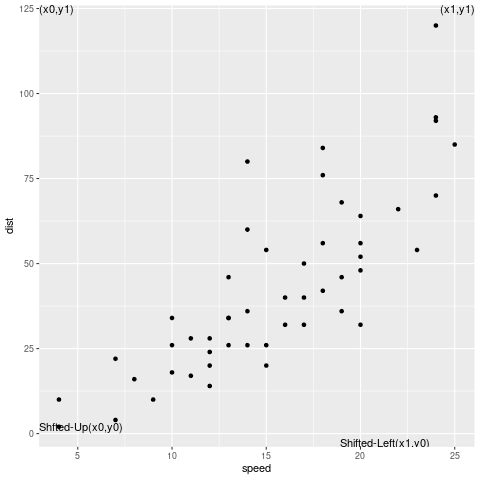
Example 2:
R
library(ggplot2)
annotations <- data.frame(
X = c(-Inf,-Inf,Inf,Inf),
Y = c(-Inf, Inf,-Inf,Inf),
text = c("Shifted-Up(x0,y0)","(x0,y1)",
"Shifted-Left(x1,y0)","(x1,y1)"),
x_adjust = c(0,0,1.5,1),
y_adjust = c(-2,1,0,1)
)
ggplot(cars, aes(speed, dist)) + geom_point()+
geom_text(data=annotations, aes(
x=X,y=Y,hjust=x_adjust,vjust=y_adjust,label=text))
|
Output:
Like Article
Suggest improvement
Share your thoughts in the comments
Please Login to comment...