Poisson Regression in R Programming
Last Updated :
10 May, 2020
A Poisson Regression model is used to model count data and model response variables (Y-values) that are counts. It shows which X-values work on the Y-value and more categorically, it counts data: discrete data with non-negative integer values that count something.
In other words, it shows which explanatory variables have a notable effect on the response variable. Poisson Regression involves regression models in which the response variable is in the form of counts and not fractional numbers.
Mathematical Equation:
log(y) = a + b1x1 + b2x2 + bnxn.....
Parameters:
- y: This parameter sets as a response variable.
- a and b: The parameter a and b are the numeric coefficients.
- x: This parameter is the predictor variable.
Creating Poisson Regression Model
The function used to create the Poisson regression model is the glm() function.
Syntax: glm(formula, data, family)
Parameters:
- formula: This parameter is the symbol presenting the relationship between the variables.
- data: The parameter is the data set giving the values of these variables.
- family: This parameter R object to specify the details of the model. It’s value is ‘Poisson’ for Logistic Regression.
Example:
Approach: To understand how we can create:
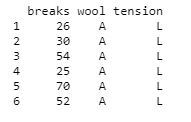
- We use the data set “warpbreaks”.
- Considering “breaks” as the response variable.
- The wool “type” and “tension” are taken as predictor variables.
Code:
input <- warpbreaks
print(head(input))
|
Output:
Create Regression Model
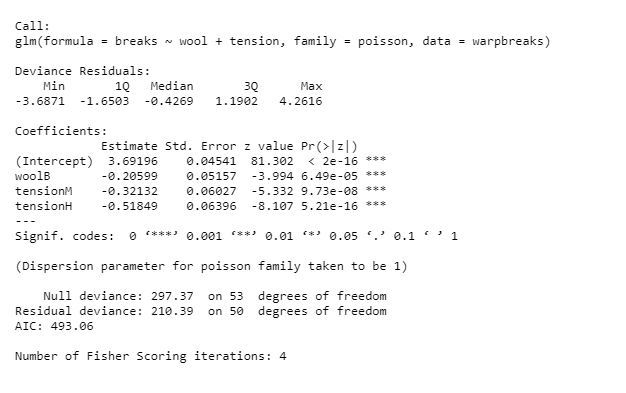
Approach: Creating the poisson regression model:
- Take the parameters which are required to make model.
- let’s use summary() function to find the summary of the model for data analysis.
Example:
output <-glm(formula = breaks ~ wool + tension,
data = warpbreaks, family = poisson)
print(summary(output))
|
Output:
Creating Poisson Regression Model using glm() function
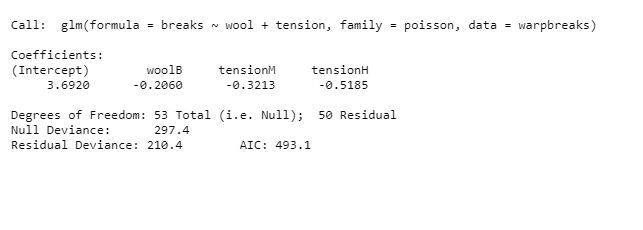
Approach: Creating the regression model with the help of the glm() function as:
- With the help of this function, easy to make model.
- Now we draw a graph for the relation between “formula”, “data” and “family”.
Example:
output_result <-glm(formula = breaks ~ wool + tension,
data = warpbreaks, family = poisson)
output_result
|
Output:
Like Article
Suggest improvement
Share your thoughts in the comments
Please Login to comment...