Plotting Graphs using Two Dimensional List in R Programming
Last Updated :
01 Jun, 2020
List is a type of an object in R programming. Lists can contain heterogeneous elements like strings, numeric, matrices, or even lists. A list is a generic vector containing other objects. Two-dimensional list can be created in R programming by creating more lists in a list or simply, we can say nested lists. The list() function in R programming is used to create a list. In this article, we’ll learn to create plot graph using Two Dimensional List in R programming.
Creating a Two Dimensional list
A Two Dimensional list can be created with the use of list() function.
Syntax: list(x)
Parameter:
x: represents objects to be inserted in list
Example:
x <- c(1, 2, 3, 4)
y <- LETTERS[1:4]
ls <- list(
list(x),
list(y)
)
print(ls)
|
Output:
[[1]]
[[1]][[1]]
[1] 1 2 3 4


[[2]]
[[2]][[1]]
[1] "A" "B" "C" "D"
Creating Plot Graph using Two Dimensional List
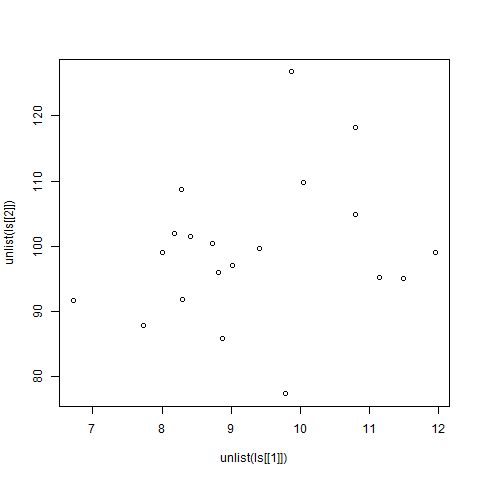
To create plot graphs, lists have to be passed as vectors to the plot() function as coordinate values. The unlist() function converts the list into an atomic type of vector.
Example:
ls <- list(
list(rnorm(20, mean = 10, sd = 2)),
list(rnorm(20, mean = 100, sd = 10)))
png(file = "2DListGraph.png")
plot(unlist(ls[[1]]), unlist(ls[[2]]))
dev.off()
|
Output:
Like Article
Suggest improvement
Share your thoughts in the comments
Please Login to comment...