Plotting graph For IRIS Dataset Using Seaborn And Matplotlib
Last Updated :
21 Mar, 2024
Matplotlib.pyplot library is most commonly used in Python in the field of machine learning. It helps in plotting the graph of large dataset. Not only this also helps in classifying different dataset. It can plot graph both in 2d and 3d format. It has a feature of legend, label, grid, graph shape, grid and many more that make it easier to understand and classify the dataset.
Seaborn provides a beautiful with different styled graph plotting that make our dataset more distinguishable and attractive.
Installation
To install the package write the below code in terminal of ubuntu/Linux or Window Command prompt.
pip install matplotlib
pip install seaborn
Attribute Information about data set:
Attribute Information:
   -> sepal length in cm
   -> sepal width in cm
   -> petal length in cm
   -> petal width in cm
   -> class:
              Iris Setosa
              Iris Versicolour
              Iris Virginica

Number of Instances: 150

Summary Statistics:
             Min  Max   Mean    SD   Class Correlation
   sepal length: 4.3  7.9   5.84  0.83    0.7826
    sepal width: 2.0  4.4   3.05  0.43   -0.4194
   petal length: 1.0  6.9   3.76  1.76    0.9490  (high!)
    petal width: 0.1  2.5   1.20  0.76    0.9565  (high!)

Class Distribution: 33.3% for each of 3 classes.
Plotting graph For IRIS Dataset Using Seaborn Library And matplotlib.pyplot library
Loading data
Python3
import numpy as np
import pandas as pd
import matplotlib.pyplot as plt
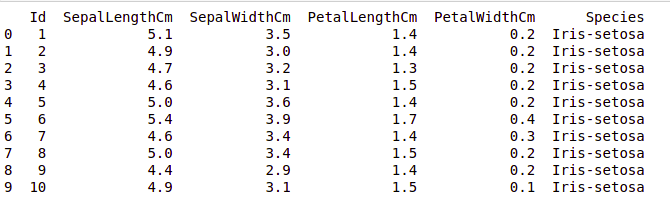
data = pd.read_csv("Iris.csv")
print (data.head(10))
|
Output:
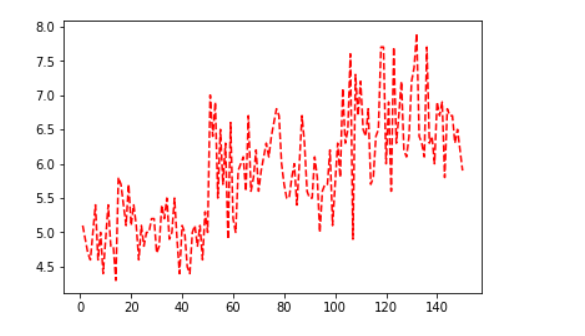
Plotting Using Matplotlib
Python3
import pandas as pd
import matplotlib.pyplot as plt
iris = pd.read_csv("Iris.csv")
plt.plot(iris.Id, iris["SepalLengthCm"], "r--")
plt.show
|
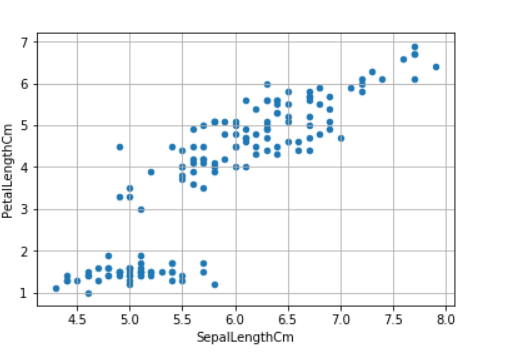
Scatter Plot
Python3
iris.plot(kind ="scatter",
x ='SepalLengthCm',
y ='PetalLengthCm')
plt.grid()
|
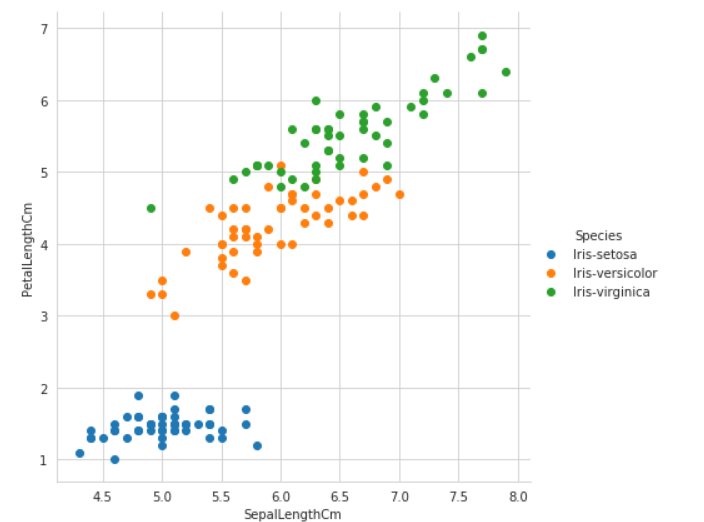
Plotting using Seaborn
Python3
import seaborn as sns
iris = sns.load_dataset('iris')
sns.set_style("whitegrid")
sns.FacetGrid(iris, hue ="species",
height = 6).map(plt.scatter,
'sepal_length',
'petal_length').add_legend()
|
Like Article
Suggest improvement
Share your thoughts in the comments
Please Login to comment...