Plotting A Square Wave Using Matplotlib, Numpy And Scipy
Last Updated :
20 Apr, 2022
Prerequisites: linspace, Mathplotlib, Scipy
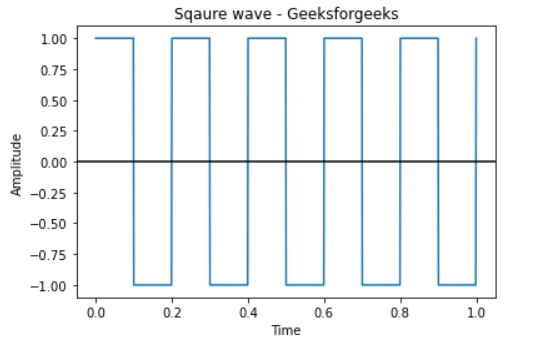
A square wave is a non-sinusoidal periodic waveform in which the amplitude alternates at a steady frequency between the fixed minimum and maximum values, with the same duration at minimum and maximum. Graphical representations are always easy to understand and are adopted and preferable before any written or verbal communication. In this article, we will try to understand, How can we plot Square waves using the Scipy python module.
Approach:
- Import required module.
- Create a sample rate.
- Plot a square wave.
- Label the graph.
- Display Graph.
Step 1: Import module
Python3
from scipy import signal
import matplotlib.pyplot as plot
import numpy as np
|
Step 2: The NumPy linspace function is a tool in Python for creating numeric sequences that return evenly spaced numbers over a specified interval.
Python3
t = np.linspace(0, 1, 1000, endpoint = True)
|
Step 3: plot.plot function: This method accepts the following parameters and Plot the square wave signal.
Syntax:
scipy.signal.square(t)
Parameter:
Return:
Output array containing the square waveform.
Python3
plot.plot(t, signal.square(2 * np.pi * 5 * t))
|
Step 4: Give title name, x-axis label name, y-axis label name.
Python3
plot.xlabel('Time')
plot.ylabel('Amplitude')
plot.title('Square wave - Geeksforgeeks')
|
Step 5: plot.axhline() : The axhline() function in pyplot module of matplotlib library is used to add a horizontal line across the axis.
Python3
plot.axhline(y=0, color='k')
|
Below is the full implementation:
Python3
from scipy import signal
import matplotlib.pyplot as plot
import numpy as np
t = np.linspace(0, 1, 1000, endpoint=True)
plot.plot(t, signal.square(2 * np.pi * 5 * t))
plot.xlabel('Time')
plot.ylabel('Amplitude')
plot.title('Square wave - Geeksforgeeks')
plot.axhline(y = 0, color = 'k')
plot.show()
|
Output:
Like Article
Suggest improvement
Share your thoughts in the comments
Please Login to comment...