Plotting a Sawtooth Wave using Matplotlib
Last Updated :
03 Jan, 2021
Prerequisites:
A sawtooth waveform is a non-sinusoidal waveform because its teeth look like a saw. In an inverse (or reverse) sawtooth waveform the wave suddenly ramps downwards and then rises sharply. With Matplotlib we can draw different types of Graphical data. In this article, we will try to understand, How can we plot sawtooth waves using the Scipy python module.
Approach:
- Import required module.
- Create a sample rate. The NumPy linspace function is a tool in Python for creating numeric sequences that return evenly spaced numbers over a specified interval.
Syntax:
numpy.linspace(start, stop, num = 50,
endpoint = True, retstep = False, dtype = None)
- Plot a sawtooth wave.
- Label the graph.
- Display Graph.
Function
Syntax:
scipy.signal.sawtooth(t)
Parameter:
Return:
Output array containing the sawtooth waveform.
Program:
Python3
from scipy import signal
import matplotlib.pyplot as plot
import numpy as np
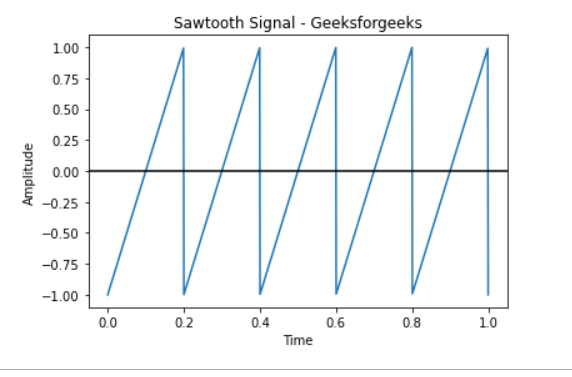
t = np.linspace(0, 1, 1000, endpoint=True)
plot.plot(t, signal.sawtooth(2 * np.pi * 5 * t))
plot.xlabel('Time')
plot.ylabel('Amplitude')
plot.title('Sawtooth Signal - Geeksforgeeks')
plot.axhline(y=0, color='k')
plot.show()
|
Output:
Like Article
Suggest improvement
Share your thoughts in the comments
Please Login to comment...