Plot the Size of each Group in a Groupby object in Pandas
Last Updated :
31 Aug, 2021
Pandas dataframe.groupby() function is one of the most useful function in the library it splits the data into groups based on columns/conditions and then apply some operations eg. size() which counts the number of entries/rows in each group. The groupby() can also be applied on series.
Syntax: DataFrame.groupby(by=None, axis=0, level=None, as_index=True, sort=True, group_keys=True, squeeze=False, **kwargs)
Parameters :
by : mapping, function, str, or iterable
axis : int, default 0
level : If the axis is a MultiIndex (hierarchical), group by a particular level or levels
as_index : For aggregated output, return object with group labels as the index. Only relevant for DataFrame input. as_index=False is effectively “SQL-style” grouped output
sort : Sort group keys. Get better performance by turning this off. Note this does not influence the order of observations within each group. groupby preserves the order of rows within each group.
group_keys : When calling apply, add group keys to index to identify pieces
squeeze : Reduce the dimensionality of the return type if possible, otherwise return a consistent type
Returns : GroupBy object
In the following example, we are going to make use to two libraries seaborn and pandas where seaborn is used for plotting and pandas for reading data. We are going to use the load_dataset() methods from seaborn to load the penguins.csv data set.
Python3
import seaborn as sns
dataset = sns.load_dataset('penguins')
print(dataset.head())
|
Output :
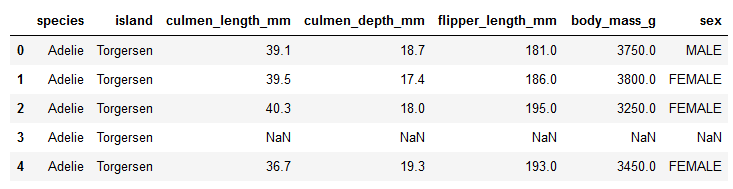
Top five rows of the dataset
More information about the data set using the info() method
Output :
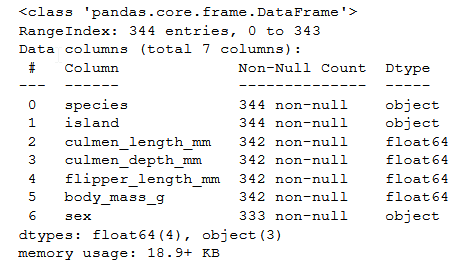
Info about the dataset
We will be grouping the data using the groupby() method according to ‘island’ and plotting it.
Plotting using Pandas :
Python3
dataset.groupby(['island']).size().plot(kind = "bar")
|
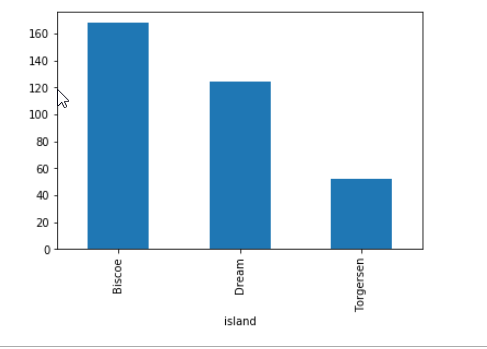
Plot of groupby() size using Pandas
Plotting using Seaborn
Python3
result = dataset.groupby(['island']).size()
sns.barplot(x = result.index, y = result.values)
|
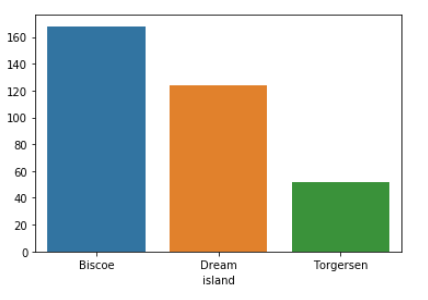
Plot of size using
Seaborn
Like Article
Suggest improvement
Share your thoughts in the comments
Please Login to comment...