Plot Only One Variable in ggplot2 Plot in R
Last Updated :
08 Jun, 2023
In this article, we will be looking at the two different methods to plot only one variable in the ggplot2 plot in the R programming language.
Draw ggplot2 Plot Based On Only One Variable Using ggplot & nrow Functions
In this approach to drawing a ggplot2 plot based on the only one variable, firstly the user needs to install and import the ggplot2 package, as here this package is responsible for the plot ggplot2 scatterplot, and further, the user needs to call the nrow functions which will here create a sequence from 1 to the number of rows in our data frame and use this sequence as an x-variable and last the user needs to call the ggplot() passed with the dataframe containing only one variable with the nrow() function passed as its parameters in the R programming language.
Syntax to install and import the ggplot2 package in the R console:
install.packages("ggplot2")
library("ggplot2")
nrow() function: nrow() function in R Language is used to return the number of rows of the specified matrix.
Syntax: nrow(x)
Parameters:
- x: matrix, vector, array, or data frame
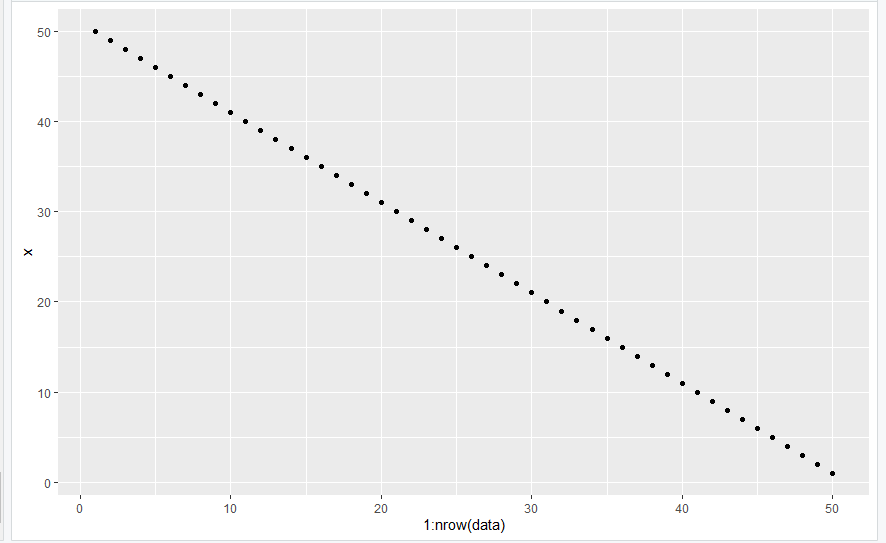
Example 1: Scatterplots with Only One Variable
In this example, we have firstly installed and imported the ggplot2 library to the console and then create a data frame containing only one variable x with the data points from 50 to 1 and further using the ggplot() and the nrow() function passed with the required parameters we are resulting to the scatter plot of the given data frame of one variable in the R programming language.
R
library("ggplot2")
data <- data.frame(x<-50:1)
ggplot(data, aes(x = 1:nrow(data), y = x)) +geom_point()
|
Output:
One Variable Plot in R
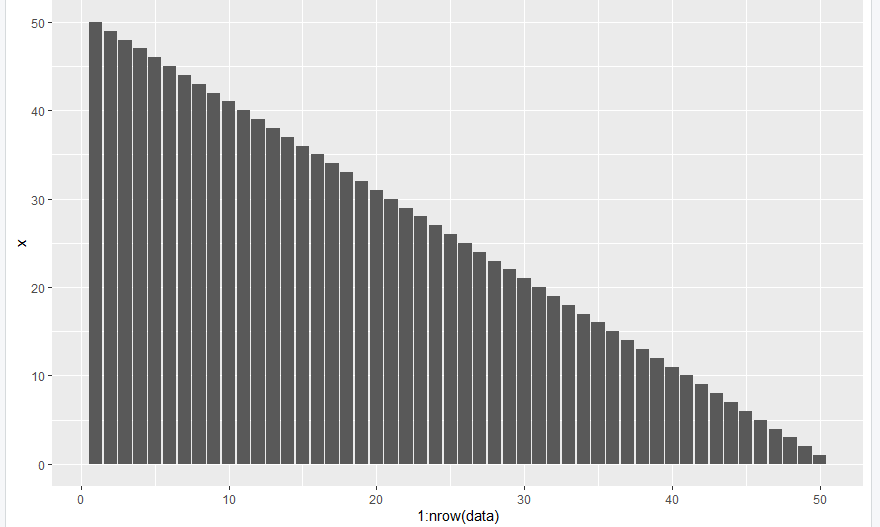
Example 2: Bar Plot with Only One Variable
In this example, we have firstly installed and imported the ggplot2 library to the console and then create a data frame containing only one variable x with the data points from 50 to 1 and further used the ggplot() with the geom_bar() function and the nrow() function passed with the required parameters we are resulting to the bar plot of the given data frame of one variable in the R programming language.
R
library("ggplot2")
data <- data.frame(x<-50:1)
ggplot(data, aes(x = 1:nrow(data), y = x)) +
geom_bar(stat="identity")
|
Output
One Variable Plot in R
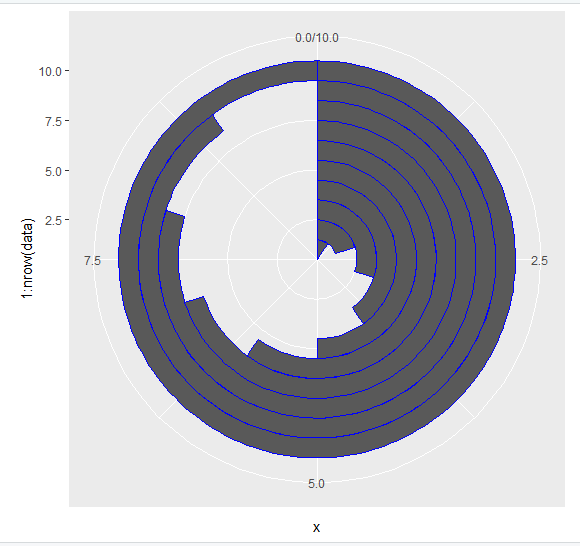
Example 3: Polar Coordinates with Only One Variable
In this example, we have installed and imported the ggplot2 library to the console and then create a data frame containing only one variable x with the data points from 1 to 10 and further used the ggplot() with the geom_bar() and coord_polar() function and the nrow() function passed with the required parameters we are resulting to the pie plot of the given data frame of one variable in the R programming language.
R
library("ggplot2")
data <- data.frame(x<-1:10)
ggplot(data, aes(x = 1:nrow(data), y = x)) +
geom_bar(width = 1, stat = "identity", color = "blue") +
coord_polar("y", start = 0)
|
Output:
One Variable Plot in R
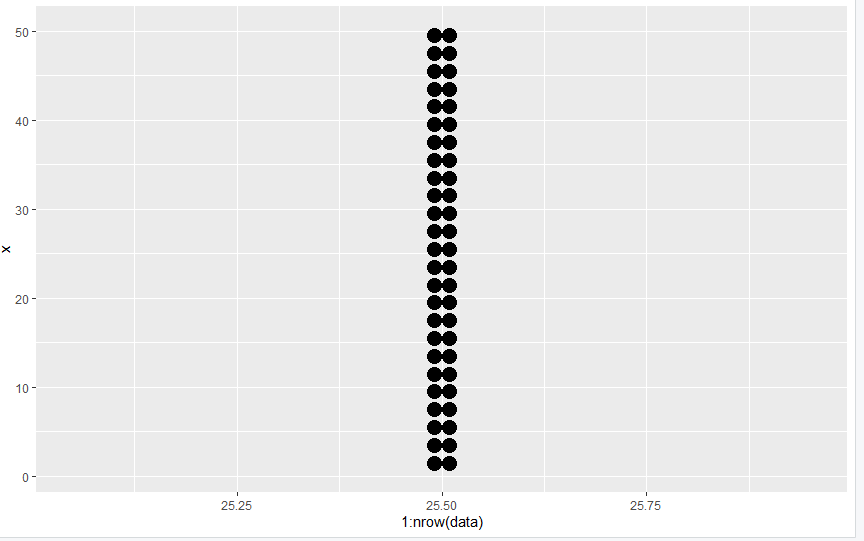
Example 4: Dot Plot with Only One Variable
In this example, we have installed and imported the ggplot2 library to the console and then create a data frame containing only one variable x with the data points from 50 to 1 and further used the ggplot() with the geom_dotplot() function and the nrow() function passed with the required parameters we are resulting to the dot plot of the given data frame of one variable in the R programming language.
R
library("ggplot2")
data <- data.frame(x<-50:1)
ggplot(data, aes(x = 1:nrow(data), y = x)) +
geom_dotplot(binaxis='y', stackdir='center')
|
Output:
One Variable Plot in R
Method 2: Draw ggplot2 Plot Based On Only One Variable Using qplot & seq_along Functions
In this approach to drawing a ggplot2 plot based on only one variable, the user needs to call the qplot() and the seq_along() functions from the ggplot2 package passed with the data frame with only one variable to the qplot() and the seq_along() functions which will result to the scatter plot accordingly to the single variable present in the data frame in the R programming language.
qplot() function: qplot() is a shortcut designed to be familiar if you’re used to base plot(). It’s a convenient wrapper for creating a number of different types of plots using a consistent calling scheme. It’s great for allowing you to produce plots quickly.
Syntax: qplot(x,y)
Parameters:
- x, y: Aesthetics passed into each layer
Example:
In this example, here also we have installed and imported the ggplot2 package and created the data frame of only one variable x with 50 to 1 data points as done in the previous example, and then we have called the qplot() with the seq_along() function and passed the seq_along() function as the parameter to the qplot function with the created data frame also and this is resulting to the scatter plot of the given data frame of one variable in the R programming language.
R
library("ggplot2")
data <- data.frame(x<-50:1)
qplot(seq_along(data$x), data$x)
|
Output:
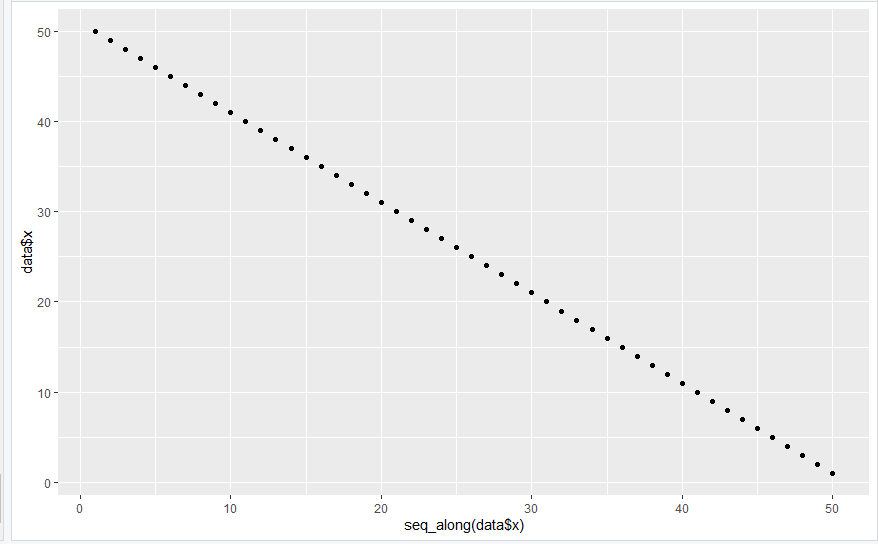
One Variable Plot in R
Like Article
Suggest improvement
Share your thoughts in the comments
Please Login to comment...