Plot Multiple Columns of Pandas Dataframe on Bar Chart with Matplotlib
Last Updated :
24 Jan, 2021
Prerequisites:
In this article, we will learn how to plot multiple columns on bar chart using Matplotlib. Bar Plot is used to represent categories of data using rectangular bars. We can plot these bars with overlapping edges or on same axes. Different ways of plotting bar graph in the same chart are using matplotlib and pandas are discussed below.
Method 1: Providing multiple columns in y parameter
The trick here is to pass all the data that has to be plotted together as a value to ‘y’ parameter of plot function.
Syntax:
matplotlib.pyplot.plot(\*args, scalex=True, scaley=True, data=None, \*\*kwargs)
Approach:
- Import module
- Create or load data
- Pass data to plot()
- Plot graph
Example:
Python3
import pandas as pd
import matplotlib.pyplot as plt
df = pd.DataFrame({
'Name': ['John', 'Sammy', 'Joe'],
'Age': [45, 38, 90],
'Height(in cm)': [150, 180, 160]
})
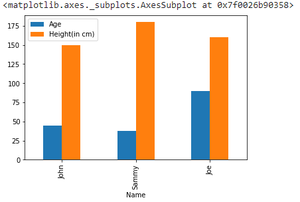
df.plot(x="Name", y=["Age", "Height(in cm)"], kind="bar")
|
Output:
Method 2: By plotting on the same axis
Plotting all separate graph on the same axes, differentiated by color can be one alternative. Here again plot() function is employed.
Approach:
- Import module
- Create or load data
- Plot first graph
- Plot all other graphs on the same axes
Example:
Python3
import pandas as pd
import matplotlib.pyplot as plt
df = pd.DataFrame({
'Name': ['John', 'Sammy', 'Joe'],
'Age': [45, 38, 90],
'Height(in cm)': [150, 180, 160]
})
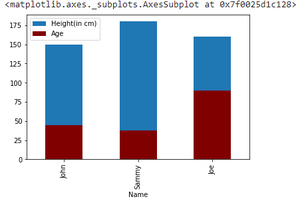
ax = df.plot(x="Name", y="Height(in cm)", kind="bar")
df.plot(x="Name", y="Age", kind="bar", ax=ax, color="maroon")
|
Output:
Method 3: By creating subplots
Another way of creating such a functionality can be plotting multiple subplots and displaying them as one. This can be done using subplot() function.
Syntax:
subplot(nrows, ncols, index, **kwargs)
Approach:
- Import module
- Create or load data
- Create multiple subplots
- Plot on single axes
Example:
Python3
import pandas as pd
import matplotlib.pyplot as plt
df = pd.DataFrame({
'Name': ['John', 'Sammy', 'Joe'],
'Age': [45, 38, 90],
'Height(in cm)': [150, 180, 160]
})
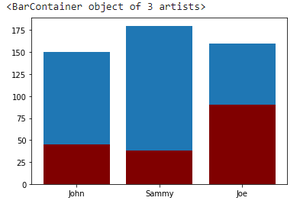
ax = plt.subplot()
ax.bar(df["Name"], df["Height(in cm)"])
ax.bar(df["Name"], df["Age"], color="maroon")
|
Output:
Like Article
Suggest improvement
Share your thoughts in the comments
Please Login to comment...