Plot Cumulative Distribution Function in R
Last Updated :
26 Mar, 2024
In this article, we will discuss how to plot a cumulative distribution function (CDF) in the R Programming Language.
The cumulative distribution function (CDF) of a random variable evaluated at x, is the probability that x will take a value less than or equal to x. To calculate the cumulative distribution function in the R Language, we use the ecdf() function. The ecdf() function in R Language is used to compute and plot the value of the Empirical Cumulative Distribution Function of a numeric vector. The ecdf() function takes the data vector as an argument and returns the CDF data.
Syntax: ecdf( data_vector )
Parameter:
- data_vector: determines the vector that contains data for CDF calculation.
Plot cumulative distribution function in base R
To plot a CDF function in base R, we first calculate the CDF by using the ecdf() function. Then we use the plot() function to plot the CDF plot in the R Language. The plot function takes the result of the ecdf() function as an argument to plot the CDF plot.
Syntax: plot( CDF )
Parameter:
- CDF: determines the cumulative distribution function calculated using the ecdf() function.
Cumulative distribution function in base R
Here, is an example of a basic Cumulative Distribution Function Plot in the R Language.
R
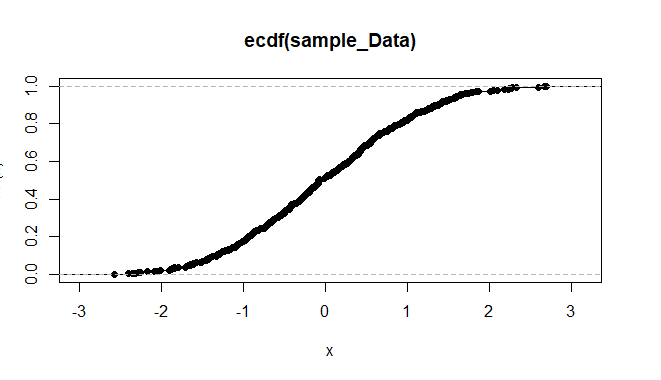
# create sample data
sample_Data = rnorm(500)

# calculate CDF
CDF <- ecdf(sample_Data )

# draw the cdf plot
plot( CDF )
Output:
Cumulative Distribution Function in R
Cumulative distribution function in base R using iris dataset
R
data(iris)
plot(ecdf(iris$Petal.Length))
Output:

Cumulative Distribution Function in R
Plot CDF of Known Distribution
To plot the cumulative distribution function of a standard distribution in a specific known range, we use the curve() function in the R Language. The curve() function draws a curve corresponding to a function over the interval. It takes an expression as an argument that in this case will be pnorm along with the limits from and to and returns a Normal CDF Plot.
Syntax: curve( expression, from, to )
Parameters:
- expression: determines the expression function for CDF calculation.
- from: determines the lower limit of data.
- to: determines the upper limit of data.
Here, is an example of a normal CDF plot
R
# plot normal CDF plot
curve(pnorm, from = -10, to = 10)
Output:

Cumulative Distribution Function in R
Plot CDF of Known Distribution using ggplot2 Package
To draw the same plot in the ggplot2 package library, we use the stat_function() function. The stat_function takes the expression function as a fun argument and converts the curve according to that expression in a basic ggplot2 plot.
Syntax: plot + stat_function( fun )
Parameters:
- fun: determines the function for the shape of the plot.
Here, is an example of a normal CDF plot using ggplot2.
R
# Embrace the Artistry of ggplot2
library(ggplot2)

# Craft a Canvas: Create a sample dataframe for upper and lower limits
sample_limit <- data.frame(x = c(-10, 10))

# Unleash the Power of Probability: Design an Elegant Cumulative Distribution Function
ggplot(sample_limit, aes(x = x)) +
  stat_function(fun = pnorm, color = "skyblue", size = 2) +

  # Add a Dash of Style: Customize the aesthetics for a visually appealing touch
  theme_minimal() +
  labs(
    title = "Exquisite Cumulative Distribution Function (CDF) Plot",
    x = "X-axis (Sample Values)",
    y = "Cumulative Probability",
    caption = "Artfully crafted with ggplot2"
  )
Output:

Cumulative Distribution Function in R
Conclusion
Plotting a Cumulative Distribution Function (CDF) in R is an insightful and visually engaging way to explore the cumulative probability distribution of a dataset. Leveraging the power of the ggplot2 library, we can seamlessly create elegant and informative CDF plots. By carefully customizing aesthetics, including color, line size, and labels, we transform a standard plot into an exquisite representation of cumulative probabilities.
Like Article
Suggest improvement
Share your thoughts in the comments
Please Login to comment...