Plot Arrows Between Points in a Graph in R Programming – arrows() Function
Last Updated :
25 Jun, 2020
arrows() function in R Language is used to create arrows between the points on the graph specified.
Syntax: arrows(x0, y0, x1, y1, length)
Parameters:
x0: represents x-coordinate of point from which to draw the arrow
y0: represents y-coordinate of point from which to draw the arrow
x1: represents x-coordinate of point to which the arrow is drawn
y1: represents y-coordinate of point to which the arrow is drawn
length: represents length of the edge of the arrow head (in inches)
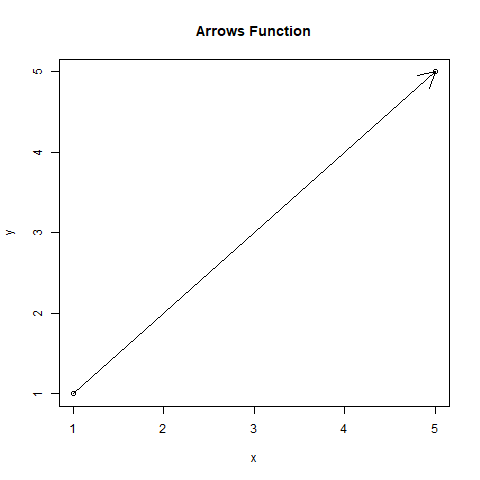
Example 1:
x0 <- 1
y0 <- 1
x1 <- 5
y1 <- 5
x <- c(x0, x1)
y <- c(y0, y1)
png(file = "arrows1GFG.png")
plot(x, y, main = "Arrows Function")
arrows(x0, y0, x1, y1)
dev.off()
|
Output:
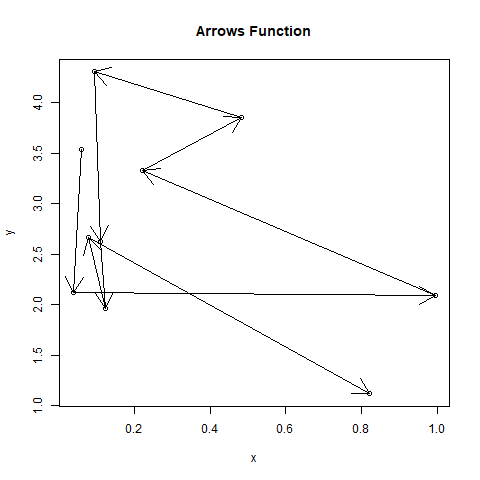
Example 2:
x <- runif(10, 0, 1)
y <- runif(10, 1, 5)
png(file = "arrows2GFG.png")
plot(x, y, main = "Arrows Function")
s <- seq(length(x) - 1)
arrows(x[s], y[s], x[s + 1], y[s + 1])
dev.off()
|
Output:
Like Article
Suggest improvement
Share your thoughts in the comments
Please Login to comment...