Plot a line along 2 points in MATLAB
Last Updated :
28 Mar, 2019
Our objective is to plot a line along 2 points in MATLAB without using inbuilt functions for plotting. A black and white image can be represented as a 2 order matrix. The first order is for the rows and the second order is for the columns, the pixel value will determine the color of the pixel based on the grayscale color format.
Approach :
- We are given with 2 points. Let the coordinates of the points be (x1, y1) and (x2, y2).
- We find the slope of these 2 points and store it in m.
m = (y2-y1)/(x2-x1);
- Now for every pixel, find the slope between the pixel and one of the point.
m2 = (y2-j)/(x2-i);
- If the slope obtained is equal to the slope of the points, then change the color to black (0).
Implementation:
im = uint8(zeros(400, 400)) + 255;
x1 = 100;
y1 = 100;
x2 = 200;
y2 = 200;
m = (y2-y1)/(x2-x1);
for i = 1:400
for j = 1:400
m2 = (y2-j)/(x2-i);
if m == m2
im(i, j) = 0;
end
end
end
imshow(im);
|
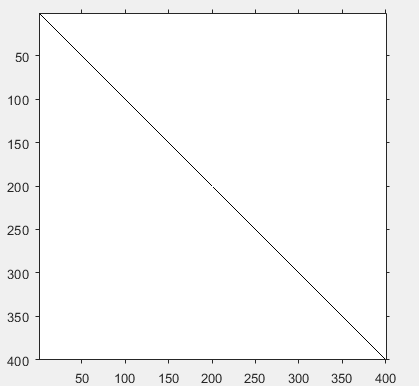
Output :
Like Article
Suggest improvement
Share your thoughts in the comments
Please Login to comment...