Placement prediction using Logistic Regression
Last Updated :
08 Sep, 2021
Prerequisites: Understanding Logistic Regression, Logistic Regression using Python
In this article, we are going to discuss how to predict the placement status of a student based on various student attributes using Logistic regression algorithm.
Placements hold great importance for students and educational institutions. It helps a student to build a strong foundation for the professional career ahead as well as a good placement record gives a competitive edge to a college/university in the education market.
This study focuses on a system that predicts if a student would be placed or not based on the student’s qualifications, historical data, and experience. This predictor uses a machine-learning algorithm to give the result.
The algorithm used is logistic regression. Logistic regression is basically a supervised classification algorithm. In a classification problem, the target variable(or output), y, can take only discrete values for given set of features(or inputs), X. Talking about the dataset, it contains the secondary school percentage, higher secondary school percentage, degree percentage, degree, and work experience of students. After predicting the result its efficiency is also calculated based on the dataset. The dataset used here is in .csv format.
Below is the step-by-step Approach:
Step 1: Import the required modules.
Python
import pandas as pd
import numpy as np
import matplotlib.pyplot as plt
|
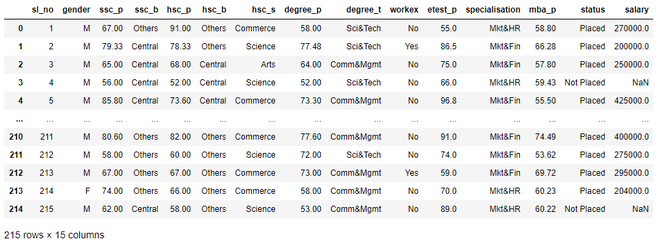
Step 2: Now to read the dataset that we are going to use for the analysis and then checking the dataset.
Python
dataset = pd.read_csv('Placement_Data_Full_Class.csv')
dataset
|
Output:
Step 3: Now we will drop the columns that are not needed.
Python
dataset = dataset.drop('sl_no', axis=1)
dataset = dataset.drop('salary', axis=1)
|
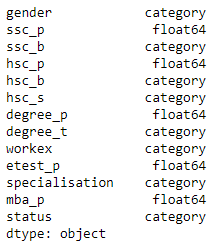
Step 4: Now before moving forward we need to pre-process and transform our data. For that, we will use astype() method on some columns and change the datatype to category.
Python
dataset["gender"] = dataset["gender"].astype('category')
dataset["ssc_b"] = dataset["ssc_b"].astype('category')
dataset["hsc_b"] = dataset["hsc_b"].astype('category')
dataset["degree_t"] = dataset["degree_t"].astype('category')
dataset["workex"] = dataset["workex"].astype('category')
dataset["specialisation"] = dataset["specialisation"].astype('category')
dataset["status"] = dataset["status"].astype('category')
dataset["hsc_s"] = dataset["hsc_s"].astype('category')
dataset.dtypes
|
Output:
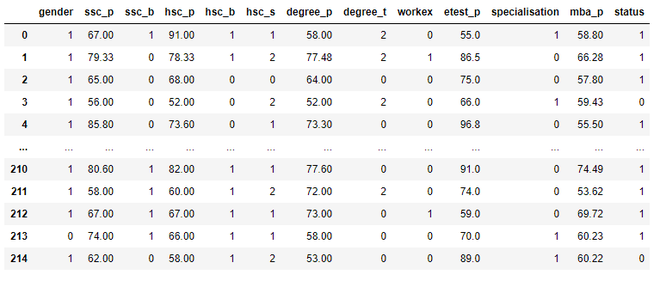
Step 5: Now we will apply codes on some of these columns to convert their text values to numerical values.
Python
dataset["gender"] = dataset["gender"].cat.codes
dataset["ssc_b"] = dataset["ssc_b"].cat.codes
dataset["hsc_b"] = dataset["hsc_b"].cat.codes
dataset["degree_t"] = dataset["degree_t"].cat.codes
dataset["workex"] = dataset["workex"].cat.codes
dataset["specialisation"] = dataset["specialisation"].cat.codes
dataset["status"] = dataset["status"].cat.codes
dataset["hsc_s"] = dataset["hsc_s"].cat.codes
dataset
|
Output:
Step 6: Now to split the dataset into features and values using iloc() function:
Python
X = dataset.iloc[:, :-1].values
Y = dataset.iloc[:, -1].values
Y
|
Output:
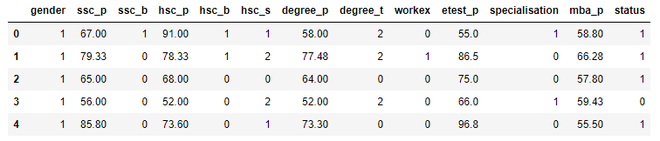
Step 7: Now we will split the dataset into train and test data which will be used to check the efficiency later.
Python
from sklearn.model_selection import train_test_split
X_train, X_test, Y_train, Y_test = train_test_split(X, Y,
test_size=0.2)
dataset.head()
|
Output:
Step 8: Now we need to train our model for which we will need to import a file, and then we will create a classifier using sklearn module. Then we will check the accuracy of the model.
Python
from sklearn.linear_model import LogisticRegression
clf = LogisticRegression(random_state=0, solver='lbfgs',
max_iter=1000).fit(X_train,
Y_train)
clf.score(X_test, Y_test)
|
Output:
Step 9: Once we have trained the model, we will check it giving some random values:
Python
clf.predict([[0, 87, 0, 95, 0, 2, 78, 2, 0, 0, 1, 0]])
|
Output:
Step 10: To gain a more nuanced understanding of our model’s performance we need to make a confusion matrix. A confusion matrix is a table with two rows and two columns that reports the number of false positives, false negatives, true positives, and true negatives.
To get the confusion matrix it takes in two arguments: The actual labels of your test set y_test and predicted labels. The predicted labels of the classifier are stored in y_pred as follows:
Python
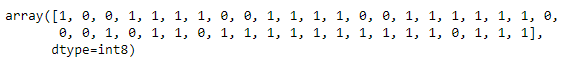
Y_pred = clf.predict(X_test)
Y_pred
|
Output:
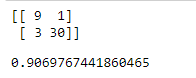
Step 11: Finally, we have y_pred, so we can generate the confusion matrix:
Python
from sklearn.metrics import confusion_matrix, accuracy_score
print(confusion_matrix(Y_test, Y_pred))
print(accuracy_score(Y_test, Y_pred))
|
Output:
Share your thoughts in the comments
Please Login to comment...