Pivot Table Slicers in Excel
Last Updated :
13 Apr, 2021
Slicers are the visual representation of filters. By using a slicer, we can filter our data in the pivot table by just clicking on the type of data we want. Slicers are found in the Analyze tab of the pivot table tools. We have an option called Insert Slicer and on clicking it, we have to select the column on the basis of which we need to filter our data.

Working with Slicers:
Here, the working of a slicer will be demonstrated by taking an example of a pivot table. Suppose we have an IMDb dataset of all the movies released in 2016 worldwide with their ratings, budget, gross revenue, country, genre, and many more things.
Suppose we want to know the budget of all the movies by country filtered by genre. For eg: We want to know the budget of all the movies in the U.S.A and the U.K which are of the comedy genre.
We can do this in two ways:
- By dragging the genre into the filter box in the field list of the pivot table
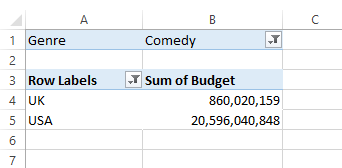
Budget of comedy films in U.S.A and U.K
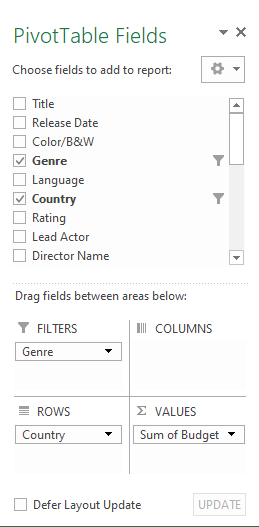
Field list of the pivot table
- Secondly, we can do the same thing by using slicers.
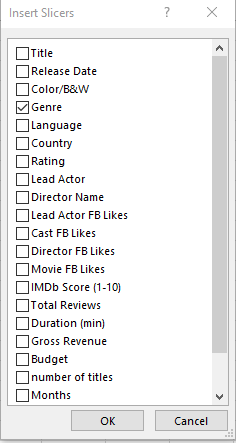
Select the column on the basis of which you want to filter data
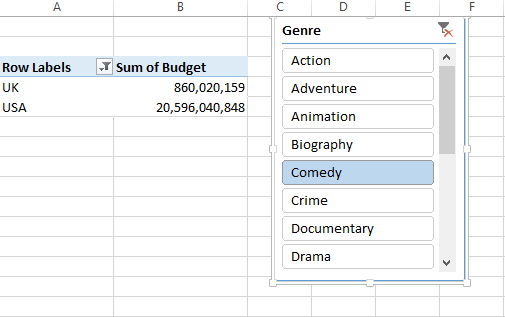
Budget of comedy films in U.S.A and U.K
So, we can see that we obtain the same results from both ways. So we can say that slicers work exactly the same way as dragging a field into a filter box in the field list of the pivot table, and they add a user-friendly interface to filter the data.
To select multiple genres, we need to enable the option of Multi-select in a slicer or just press shift and select any other genre. For eg: The picture below shows the total budget in the U.S.A and U.K of both comedy and crime genre.

Formatting of Slicers:
When we inserted a slicer, a new menu called slicer tools is created and within it, we have several options through which we can format our slicers.

If we have many items in our slicer, then we can increase the number of columns to make our slicer wide and to give a better representation.
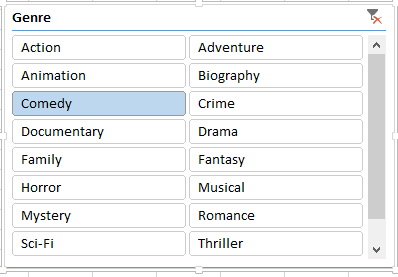
A slicer having two columns
We can also add additional formatting to our slicers by going to the slicer settings option. In that, we can choose whether we want to display the header of our slicer or not, sort our items in slicer ascending or descending, etc.

Multiple Slicers:
We can insert multiple slicers if we want to filter our data based on two columns. Each of the slicers tells the pivot table what sub-set of data to use for calculating the numbers.
For eg: In our example of the IMDb movies database that we took above, if we want to filter our data on the basis of genre and language. i.e. If we want to calculate the budget of all the Hindi movies of comedy genre in the U.S.A and U.K, then we insert two slicers, one on the basis of genre, other on the basis of language.
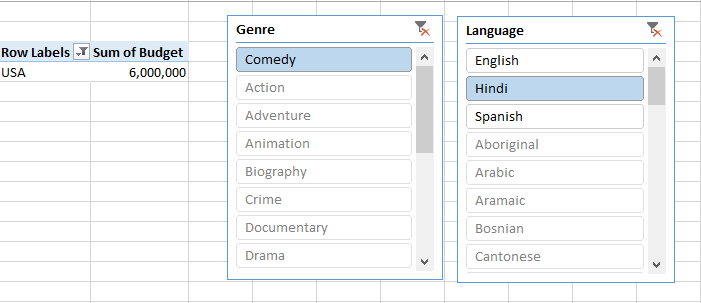
The total budget of Hindi comedy films in the U.S.A is $6,000,000
So from the picture above, we can see that there are no Hindi comedy films in the U.K.
Linking a Slicer to Multiple pivot tables:
We can link our slicer to multiple pivot tables which can build a very interactive dashboard. To do so follow the below steps:
Step 1: Right-click on the slicer and select the option of Report Connections.
Step 2: After that, you will see a menu like this.

Step 3: Now, select all the table names on which you want your slicer to work.
Suppose in our example of the IMDb movies database, I want both the budget and gross revenue to be displayed for all the comedy films in U.S.A and U.K.

So here our slicer works on both the pivot tables.
Share your thoughts in the comments
Please Login to comment...