Pandas – Groupby value counts on the DataFrame
Last Updated :
09 Dec, 2022
Prerequisites: Pandas
Pandas can be employed to count the frequency of each value in the data frame separately. Let’s see how to Groupby values count on the pandas dataframe. To count Groupby values in the pandas dataframe we are going to use groupby() size() and unstack() method.
Functions Used:
- groupby(): groupby() function is used to split the data into groups based on some criteria. Pandas objects can be split on any of their axes. The abstract definition of grouping is to provide a mapping of labels to group names
Syntax:
DataFrame.groupby(by=None, axis=0, level=None, as_index=True, sort=True, group_keys=True, squeeze=False, **kwargs)
Parameters :
- by : mapping, function, str, or iterable
- axis : int, default 0
- level : If the axis is a MultiIndex (hierarchical), group by a particular level or levels
- as_index : For aggregated output, return object with group labels as the index. Only relevant for DataFrame input. as_index=False is effectively “SQL-style” grouped output
- sort : Sort group keys. Get better performance by turning this off. Note this does not influence the order of observations within each group. groupby preserves the order of rows within each group.
- group_keys : When calling apply, add group keys to index to identify pieces
- squeeze : Reduce the dimensionality of the return type if possible, otherwise return a consistent type
Returns : GroupBy object
- size(): size method is used to get the integer representing the number of elements in object. The size method is return the number of rows times number of columns if DataFrame.
Syntax:
Dataframe.size()
- unstack(): unstack method works with the MultiIndex objects in DataFrame, producing a reshaped DataFrame with a new inner-most level of column labels.
Syntax:
Dataframe.unstack()
Approach
- Import module
- Create or load data
- Create data frame
- Count value of occurrences of each value
- Print resultant data frame
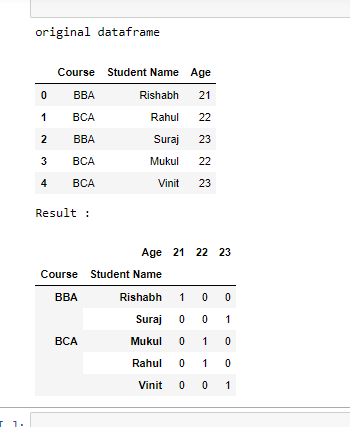
Example1:
Python
import pandas as pd
df = pd.DataFrame({
'Course': ['BBA', 'BCA', 'BBA', 'BCA', 'BCA'],
'Student Name': ['Rishabh', 'Rahul', 'Suraj', 'Mukul', 'Vinit'],
'Age': [21, 22, 23, 22, 23]})
print("original dataframe")
display(df)
df = df.groupby(['Course', 'Student Name', 'Age']).size().unstack(fill_value=0)
print("Result :")
display(df)
|
Output:
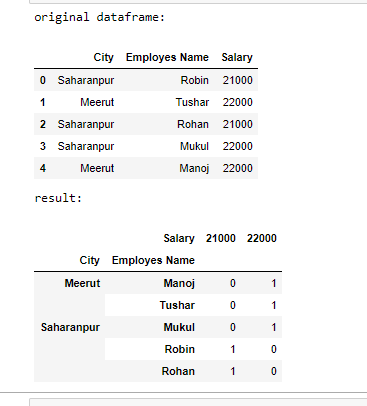
Example 2:
Python
import pandas as pd
df = pd.DataFrame({
'City': ['Saharanpur', 'Meerut', 'Saharanpur', 'Saharanpur', 'Meerut'],
'Employees Name': ['Robin', 'Tushar', 'Rohan', 'Mukul', 'Manoj'],
'Salary': [21000, 22000, 21000, 22000, 22000]})
print("original dataframe: ")
display(df)
df = df.groupby(['City', 'Employees Name', 'Salary']
).size().unstack(fill_value=0)
print("result: ")
display(df)
|
Output:
Like Article
Suggest improvement
Share your thoughts in the comments
Please Login to comment...