Pandas GroupBy – Count occurrences in column
Last Updated :
02 Jun, 2021
Using the size() or count() method with pandas.DataFrame.groupby() will generate the count of a number of occurrences of data present in a particular column of the dataframe. However, this operation can also be performed using pandas.Series.value_counts() and, pandas.Index.value_counts().
Approach
- Import module
- Create or import data frame
- Apply groupby
- Use any of the two methods
- Display result
Method 1: Using pandas.groupyby().size()
The basic approach to use this method is to assign the column names as parameters in the groupby() method and then using the size() with it. Below are various examples that depict how to count occurrences in a column for different datasets.
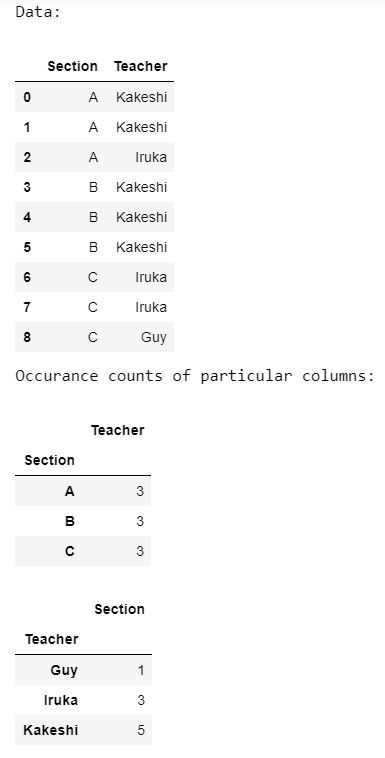
Example 1:
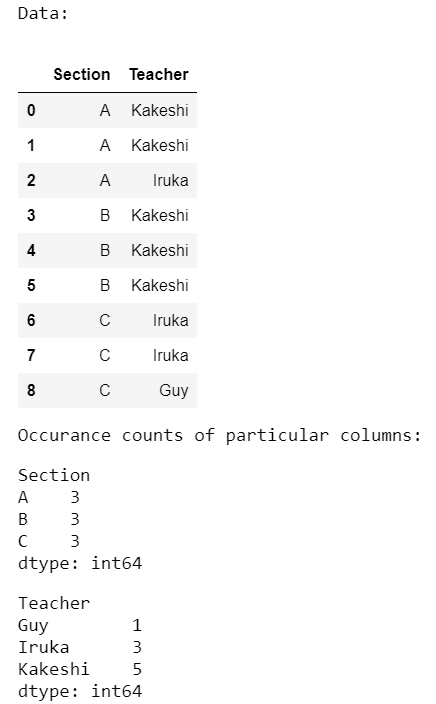
In this example, we separately count occurrences of all the columns present in a dataset.
Python3
import pandas as pd
data = pd.DataFrame({'Section': ['A', 'A', 'A', 'B', 'B',
'B', 'C', 'C', 'C'],
'Teacher': ['Kakeshi', 'Kakeshi', 'Iruka',
'Kakeshi', 'Kakeshi', 'Kakeshi',
'Iruka', 'Iruka', 'Guy']})
print('Data:')
display(data)
print('Occurrence counts of particular columns:')
occur = data.groupby(['Section']).size()
display(occur)
occur = data.groupby(['Teacher']).size()
display(occur)
|
Output:
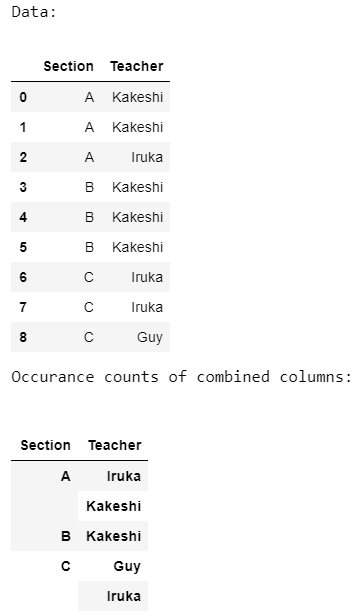
Example 2:
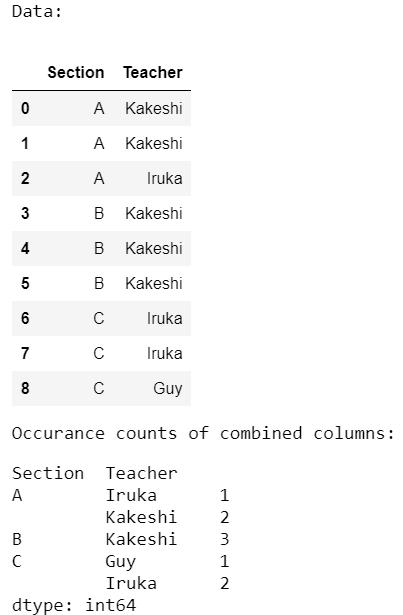
In the below program, we count occurrences of all the columns combined from the same dataset as used in the previous program.
Python3
import pandas as pd
data = pd.DataFrame({'Section': ['A', 'A', 'A', 'B', 'B', 'B',
'C', 'C', 'C'],
'Teacher': ['Kakeshi', 'Kakeshi', 'Iruka',
'Kakeshi', 'Kakeshi', 'Kakeshi',
'Iruka', 'Iruka', 'Guy']})
print('Data:')
display(data)
print('Occurrence counts of combined columns:')
occur = data.groupby(['Section', 'Teacher']).size()
display(occur)
|
Output:
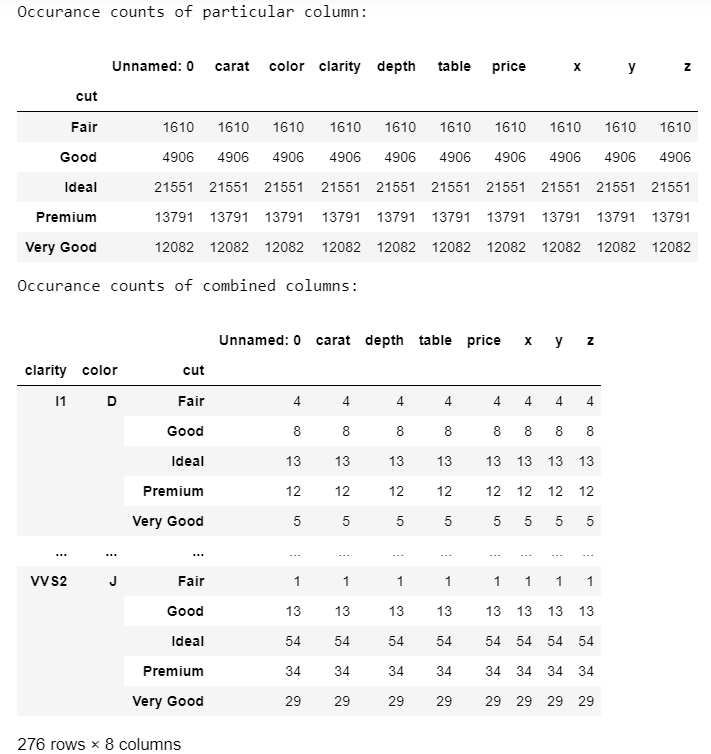
Example 3:
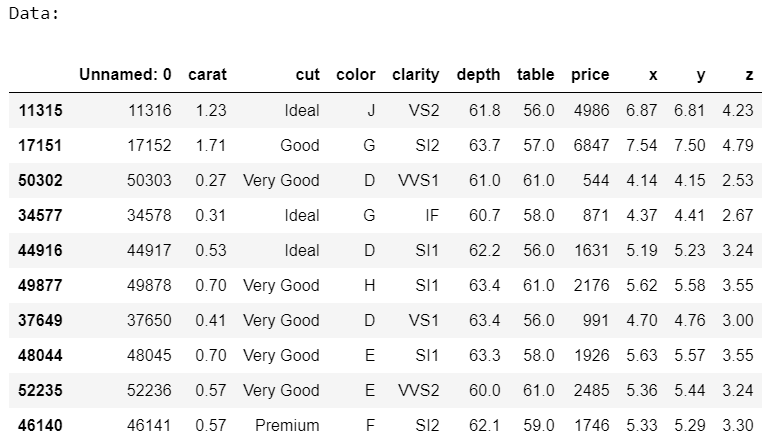
Here, we separate count occurrences and combined count occurrences of the categorical columns present in a CSV file.
Python3
import pandas as pd
data = pd.read_csv('diamonds.csv')
print('Data:')
display(data.sample(10))
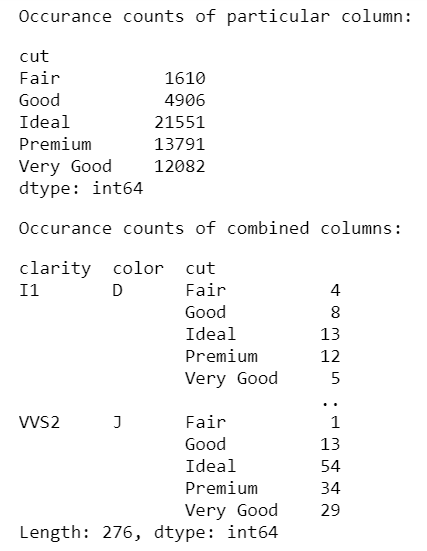
print('Occurrence counts of particular column:')
occur = data.groupby(['cut']).size()
display(occur)
print('Occurrence counts of combined columns:')
occur = data.groupby(['clarity', 'color', 'cut']).size()
display(occur)
|
Output:
Method 2: Using pandas.groupyby().count()
The basic approach to use this method is to assign the column names as parameters in the groupby() method and then using the count() with it. Below are various examples that depict how to count occurrences in a column for different datasets.
Example 1:
In this example, we separately count occurrences of all the columns present in a dataset.
Python3
import pandas as pd
data = pd.DataFrame({'Section': ['A', 'A', 'A', 'B', 'B', 'B',
'C', 'C', 'C'],
'Teacher': ['Kakeshi', 'Kakeshi', 'Iruka',
'Kakeshi', 'Kakeshi', 'Kakeshi',
'Iruka', 'Iruka', 'Guy']})
print('Data:')
display(data)
print('Occurrence counts of particular columns:')
occur = data.groupby(['Section']).size()
display(occur)
occur = data.groupby(['Teacher']).size()
display(occur)
|
Output:
Example 2:
In the below program, we count occurrences of all the columns combined from the same dataset as used in the previous program.
Python3
import pandas as pd
data = pd.DataFrame({'Section': ['A', 'A', 'A', 'B', 'B', 'B',
'C', 'C', 'C'],
'Teacher': ['Kakeshi', 'Kakeshi', 'Iruka',
'Kakeshi', 'Kakeshi', 'Kakeshi',
'Iruka', 'Iruka', 'Guy']})
print('Data:')
display(data)
print('Occurrence counts of combined columns:')
occur = data.groupby(['Section', 'Teacher']).size()
display(occur)
|
Output:
Example 3:
Here, we separate count occurrences and combined count occurrences of the categorical columns present in a CSV file.
Python3
import pandas as pd
data = pd.read_csv('diamonds.csv')
print('Data:')
display(data.sample(10))
print('Occurrence counts of particular column:')
occur = data.groupby(['cut']).size()
display(occur)
print('Occurrence counts of combined columns:')
occur = data.groupby(['clarity', 'color', 'cut']).size()
display(occur)
|
Output:
Like Article
Suggest improvement
Share your thoughts in the comments
Please Login to comment...