Pandas GroupBy – Count last value
Last Updated :
23 Sep, 2022
A groupby operation involves grouping large amounts of data and computing operations on these groups. It is generally involved in some combination of splitting the object, applying a function, and combining the results. In this article let us see how to get the count of the last value in the group using pandas.
Syntax:
DataFrame.groupby(by, axis, as_index)
Parameters:
- by (datatype- list, tuples, dict, series, array): mapping, function, label, or list of labels. The function passed is used as-is to determine the groups.
- axis (datatype int, default 0): 1 – splits columns and 0 – splits rows.
- as_index (datatype bool, default True.): Returns an object with group labels as the index, for all aggregated output,
Method 1: Using GroupBy & Aggregate function
In this approach, the user needs to call the DataFrame.groupby() function to demonstrate how to get the count of the last value in the group using pandas in the python language.
Example:
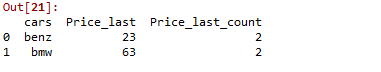
In this example, we create a sample dataframe with car names and prices as shown and apply groupby function on cars, setting as_index false doesn’t create a new index then aggregate the grouped function by the last price of the cars using the ‘last’ parameter in the aggregate function and name the column ‘Price_last’.Followed by that add another lambda function to get the number of times the car got the last price.
The dataframe used in the below example:
     cars     Price_in_million
0     benz     15
1     benz     12
2     benz     23
3     benz     23
4     bmw     63
5     bmw     34
6     bmw     63
Python3
import pandas as pd
data = pd.DataFrame({'cars': ['benz', 'benz', 'benz',
'benz', 'bmw', 'bmw', 'bmw'],
'Price_in_million': [15, 12, 23, 23,
63, 34, 63]})
data.groupby('cars', as_index=False).agg(Price_last=('Price_in_million', 'last'),
Price_last_count=('Price_in_million',
lambda x: sum(x == x.iloc[-1])))
|
Output:
In this method, the user has to call the lambda function used above to return, the count of the corresponding rows present in the dataframe in the R programming language.
Example:
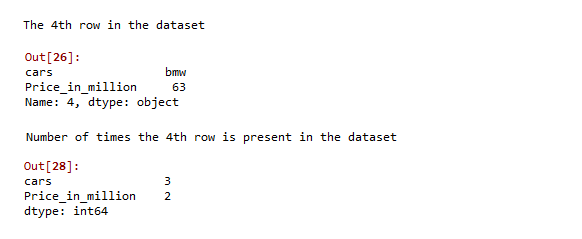
Under this example, as you can see, the car – BMW and the price 63 corresponds to the 4th row in the dataset. Applying the lambda function as above returns that the car BMW is present three times and the price 63 is present 2 times.
Python3
import pandas as pd
data = pd.DataFrame({'cars': ['benz', 'benz', 'benz',
'benz', 'bmw', 'bmw', 'bmw'],
'Price_in_million': [15, 12, 23, 23, 63, 34, 63]})
data.iloc[4]
data.apply(lambda x: sum(x==x.iloc[4]))
|
Output:
Method 3: Using GroupBy, pandas Merge & Aggregate function
The count of the last value in the group using pandas can also be got using the pandas merge function as follows.
Syntax:
DataFrame.merge(right, how='inner', on=None)
Parameters:
- right – Object to merge with. (dataframe or series object).
- how – left join, right join, outer join, Default – Inner join
- on – (label or list). Specify the Column names to join on.
Example:
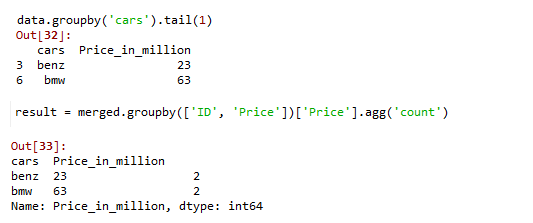
In this example, we create a sample dataframe with car names and prices as shown and apply groupby function on cars, and use tail() function to compute the final value of the group. Now, perform an inner merge with the grouped dataset and the original dataset. Finally, apply a count aggregated groupby function to get the no. of occurrences of the last value.
Python3
import pandas as pd
data = pd.DataFrame({'cars': ['benz', 'benz', 'benz',
'benz', 'bmw', 'bmw', 'bmw'],
'Price_in_million': [15, 12, 23, 23, 63, 34, 63]})
merged = pd.merge(data.groupby('cars').tail(1), data, how='inner')
result = merged.groupby(['cars', 'Price_in_million'])[
'Price_in_million'].agg('count')
print(result)
|
Output:
Method 4: Using GroupBy, pandas Merge, and Sum function
We can also get the same result by slightly altering the above approach, using the last() function instead of tail(), as shown below,
Example:
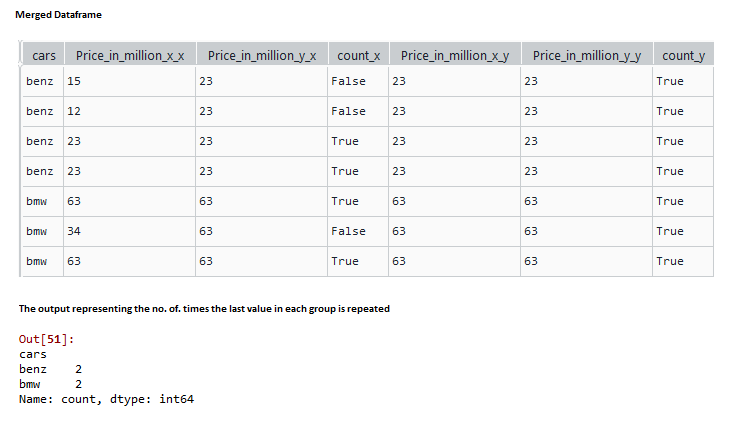
In this example, we create a sample dataframe with car names and prices as shown, apply groupby function on cars, and use the last() function to find the final element of every group and inner Merge the grouped dataset with the original dataset. Now compare the two prices in the merged columns and create a new column of bool data type, where the prices match. Now use the groupby function to get the number of times the last value of the group is repeated.
Python3
import pandas as pd
data = pd.DataFrame({'cars': ['benz', 'benz', 'benz',
'benz', 'bmw', 'bmw', 'bmw'],
'Price_in_million': [15, 12, 23, 23, 63, 34, 63]})
grouped = data.groupby('cars').last()
data = data.merge(grouped, left_on='cars', right_index=True, how='inner')
data['count'] = data['Price_in_million_x'] == data['Price_in_million_y']
data.groupby('cars')['count'].sum()
|
Output:
Like Article
Suggest improvement
Share your thoughts in the comments
Please Login to comment...