Paired Sample T-Test in Excel
Last Updated :
13 Oct, 2021
Excel is one of the most powerful and influential software developed by Microsoft, it has enormous useful features which make it the first choice of many companies. Today we are going to learn one of the excellent features of the super powerful Microsoft Excel software.
Excel provides us with the ability to perform many useful statistical tasks. One such function is the T-Test function.
The T-Tests are the hypothesis tests that are applicable in the scenarios where we need to compare the means of one or more groups. It is usually used to calculate the probability of significant difference between two groups.
Example: Let us consider a scenario wherein Alice’s dog has a fever and it lasted for five days though she gave him home treatment. After few days, the dog again had a fever, now Alice takes him to the veterinarian doctor for treatment and his fever lasted for a week. Now, Alice thinks of doing a check and asks her friends who have dogs about this. They tell her that their dogs’ fever lasted for a shorter period than Alice’s dog when they took the instant treatment. So, now Alice wants to know whether these results are repetitive. In such a scenario, the T-Test can help Alice to compare the means of those groups and give Alice the probability of those outcomes happening by chance.
There are basically three types of T-Tests as follows:
- Independent Sample T-Test.
- Paired Sample T-Test.
- One-Sample T-Test.
In this article, we will explore the Paired Sample T-Test.
Paired Sample T-Test: The paired sample T-Test is also known ad dependent sample T-Test or correlation sample T-Test. It is performed on the dependent samples or groups. It is used to evaluate the paired values, which are mostly two measurements of the same entity. It is usually used to check whether the mean difference of the two measurement groups is zero or not. This type of T-Test is used when we have the paired measurement data values.
So, now let’s see the process of executing a paired sample T-Test in MS Excel.
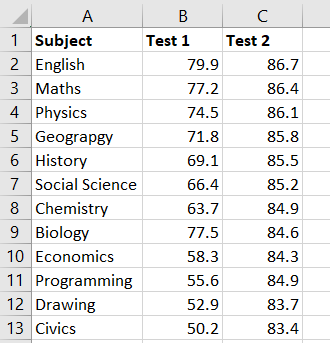
Let’s consider a scenario where we have data about the marks of students in two exams.
Step 1: Click on the Data tab.
Step 2: Navigate to the Data Analysis option in the left-most corner of the tab and click on it.

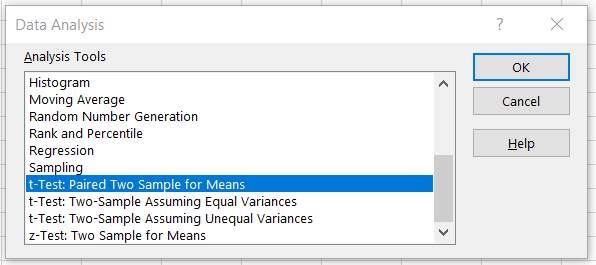
Step 3: A popup will appear on the screen, scroll down and select the t:Test: Paired Two Sample for Means option and click OK.
Step 4: The below-given popup will appear on the screen.
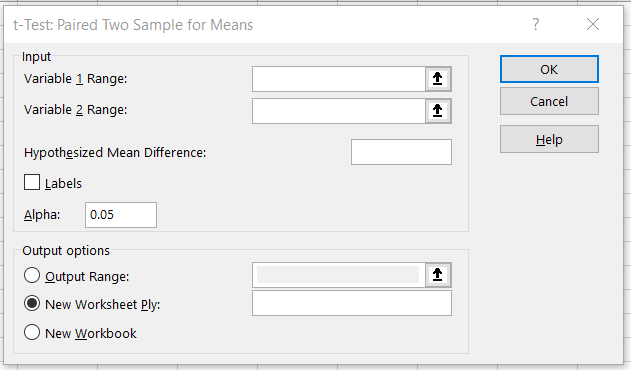
- a: For the Input, select the ranges of Test 1 and Test 2 columns for Variable 1 and Variable 2 respectively.
- b: Enter zero in the Hypothesized Mean Difference.
- c: Check the Labels checkbox.
- d: Keep other options default and click OK.
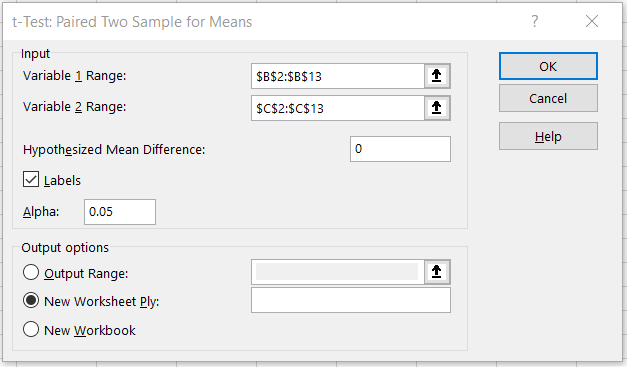
Your popup will now look similar to the image given above.
Step 5: Once you click on OK, the following changes will take place in the sheet. Widen the columns to see the values properly.
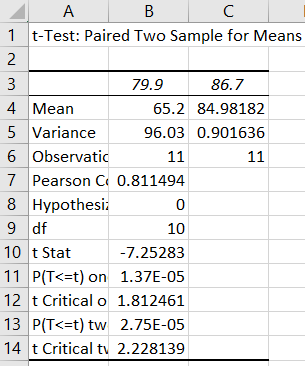
Step 6: Now, let’s observe the output.
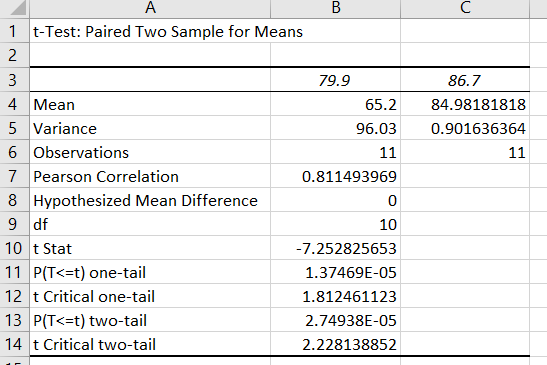
The means of test 1 is 65.2 and test 2 mean is 84.981818. The variance values are 96.03 and 0.90163 respectively. The number of observations of both groups was 11. A p-value is a probability that the results from the sample dataset are occurred by chance. Low p-values are considered good. Excel provided us with both one-tail and two-tail T-Tests.
So, here we have successfully, conducted the Paired Sample T-Test in Excel.
This article, gave an overview of the T-Tests and took a deep dive in executing the Paired Sample T-Test in MS Excel.
Like Article
Suggest improvement
Share your thoughts in the comments
Please Login to comment...