Overview of SIR Epidemic Model for Corona Virus Outbreak Prediction
Last Updated :
13 May, 2022
This model serves its purpose in case of any infectious disease spread prediction depending upon:
- the contact of the people
- the duration of the infection
- the recovery measures.
The Susceptible – Infected – Resistant(SIR) mathematical model can be used to predict the expected number of cases at a time ‘t’. We cannot directly predict the number of Corona virus cases by simply considering it as an exponential curve and using regression to give the prediction. As corona virus is an epidemic disease we can use a better alternative, the SIR dynamic model for analyzing the infectious disease transmission. Susceptible Infectious Recovered(SIR) Model: It explores how the number of people in each group can change over time. In this mathematical model, we divide the population ‘N’ into three different categories
- S(t), Susceptibles: This includes all the people that are capable of getting infected from an infectious disease.
- I(t), Infected: This includes all the people that are infected from a disease and are suffering due to it.
- R(t), Recovered: This includes the people who have recovered and are no more susceptible
S(t) + I(t) + R(t) = NHere in the equation,
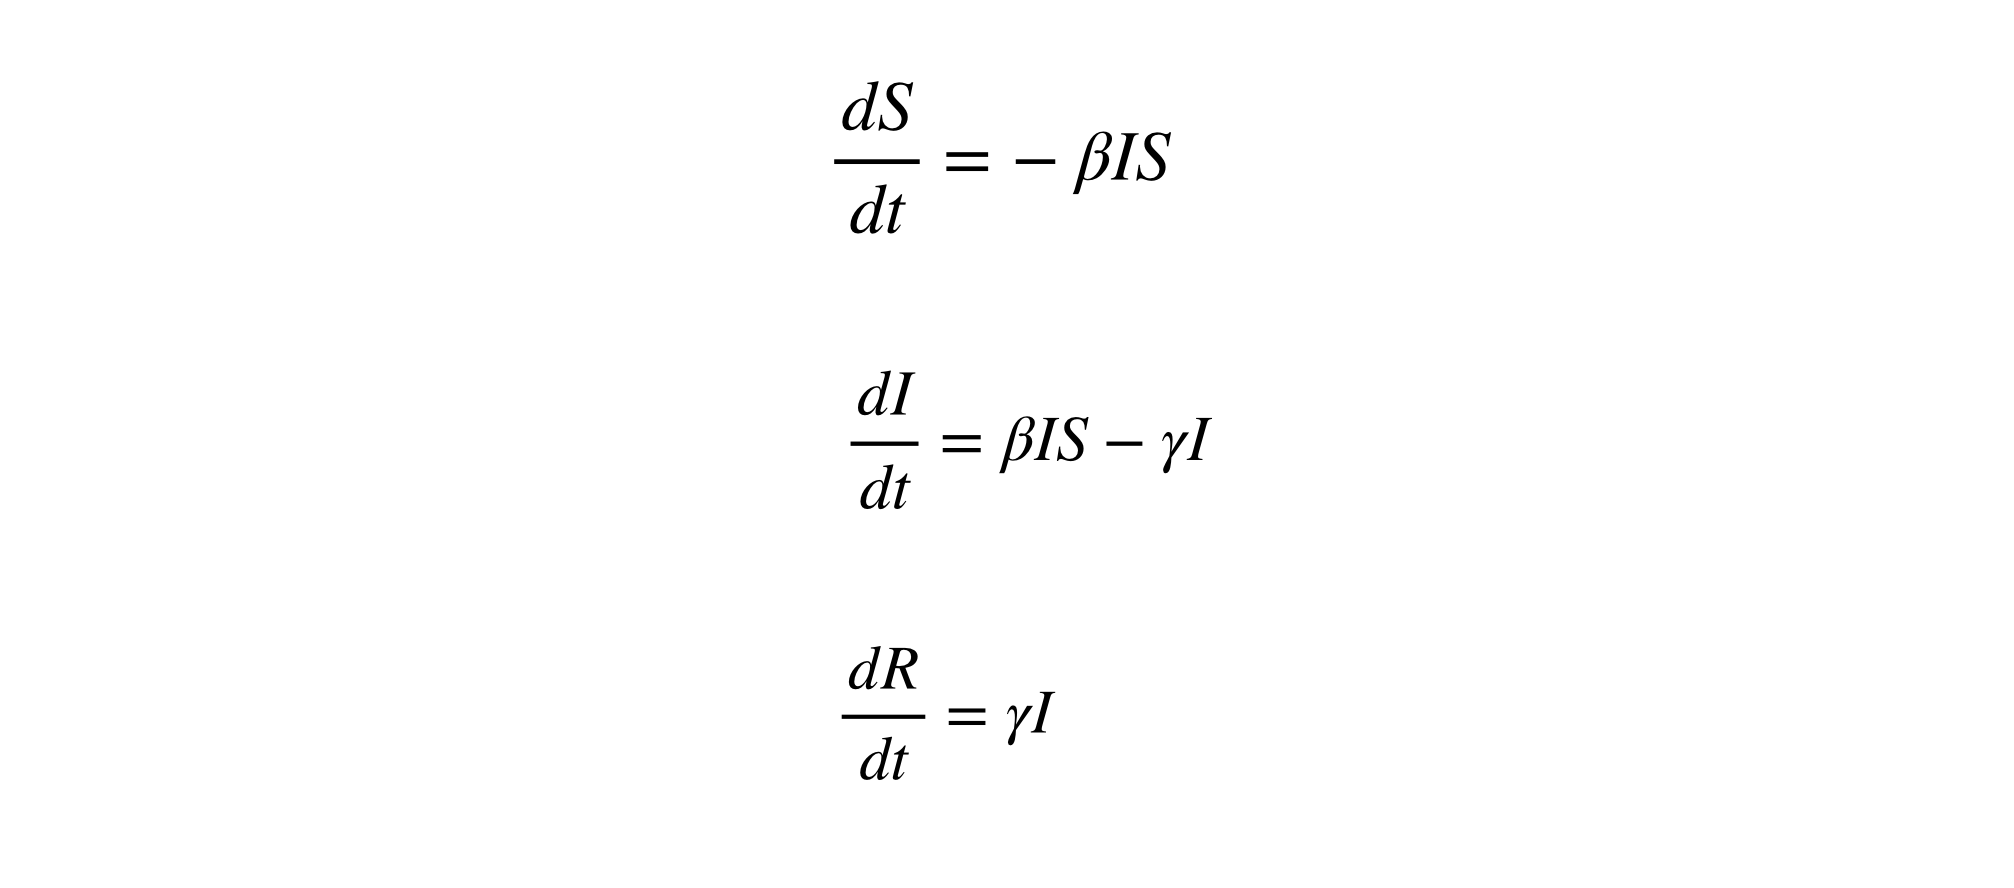
The three differential equations of the SIR Model
- dS/dt: The rate of getting susceptible to the disease from the infection with time. It depends when the susceptibles come in contact with the infected. Hence it is the product of
 , S, I where beta is the parameter of disease transmission
 - dI/dt: The rate of getting infected from the disease with time. It depends on the change in the number of people that are becoming susceptible to the disease. So the loss in the susceptibles get added here, term ‘BIS’ gets added here. It also depends upon the recovery rate multiplied by the no. of infected people. So the term -‘gamma’ * I is subtracted from it.
- dR/dt: The rate of Recovery with time. It simply is the recovery rate * the no. of infected people. So it is
 * I.
* I.
Where,  is Transmission rate and
  is Recovery rate(1/No. of days to recover) The graph plotted is shown below:
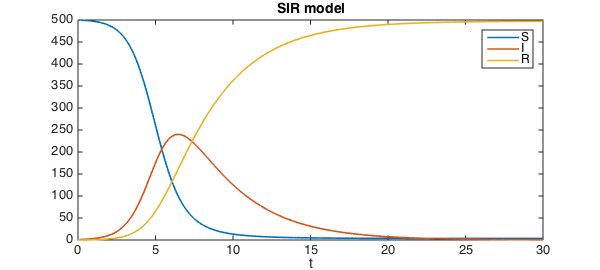 If dI/dt > 0: The no of infected people are going up and the epidemic is spreading. However if dI/dt < 0 we can say that the people in the I(t) category are reducing, we can say that the epidemic is controlled.
At t = 0, I = 1 For dI/dt * S < * I [substituting the value of dI/dt] R < 1 [R = * S / ]
So by Reducing the value of R the epidemic is controlled.[Reducing the transmission rate and increasing the recovery rate ]. By solving the differential equation from the SIR Model, we can see visualize the spreading and recovery of the corona virus cases and hence can predict the no of cases in the days ahead.The SIR model is well-fitting the actual data for both confirmed and recovered cases. This model is used by ICMR.
Like Article
Suggest improvement
Share your thoughts in the comments
Please Login to comment...