Overview of Burndown Chart in Agile
Last Updated :
22 Sep, 2023
Prerequisite: Agile Software Development and Scrum
As we know most IT companies are using the Agile software development approach for software development, in that we have many facilities to keep track of the complete development process. One of them is a burn-down chart. This chart helps to determine work done in each iteration, how much work is remaining, how much work has been completed till now, and what is the expected deadline the remaining portion will be completed. So, in this article, we will learn more about the burndown chart, how this chart is used and what are the advantages of this chart.
Burndown Chart:
Burndown chart is a major parameter used in agile software development and scrum to detect how much work remains to be completed. It is the graphical representation of showing the left-out portion of the task versus time. Generally, time is taken on the abscissa and left out work on ordinates. It is highly used when a project is going to be done. The company gets the knowledge of ‘How the team members are working”, and “Can determine the accomplishment of the task”.
From the burn-down chart graph, we can estimate when the project is going to be complete. It is generally useful when a team does not make any progress in the project in the middle may be due to any reason, at that time they take the help of it and plan accordingly to complete the project within the given time. It checks the productivity of the work. It is widely used in agile and scrum project management.
Steps to Create Burndown Chart:
As from above, we got an idea that it is the graphical representation of work done, work to be done, and the time required for pending work done. So these are the main components that are involved during the burndown chart scrum creation steps. Let’s know the steps individually.
- Estimating Work: Estimating work means from the backlog deciding what tasks need to be done and how much time is required to complete these tasks. More specifically how many user stories in how many days?
- Estimating Time: Estimating remaining time means how much time is left for a sprint.
- Estimating Effort: Estimating effort means managing effort accordingly looking at the work left and time left and tracking the burndown slope(means work completion track). In Y-axis a point(work needs to be done) and in X-axis a point(time remaining), the straight line from the Y-point to the X-point is the burn downslope.
- Tracking Progress: Tracking daily progress includes comparing the actual daily progress with the expected progress as per effort estimation. So if the daily progress line is below the burndown slope then the team is ahead of schedule, if the daily progress line is above the burndown slope then the team is far behind the target and if the daily progress line and burndown slope are lined up then it is in the right track.
Let’s see an example to understand it more clearly.
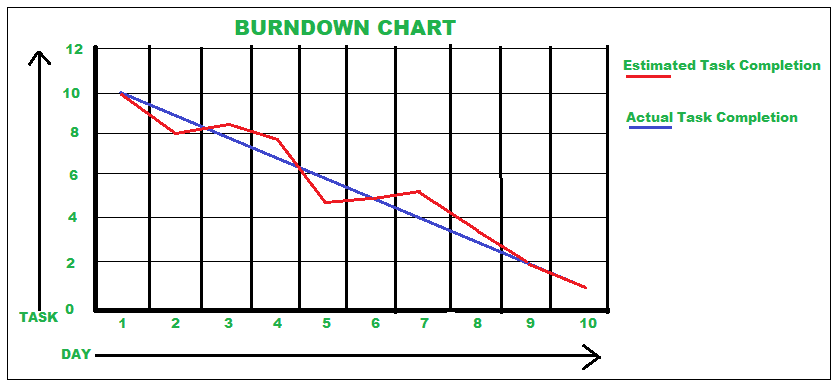
In the above example, the blue line indicates the estimated task completion line and the orange line indicates the actual task completion line. According to the above Step:4, it can be determined when it was ahead of schedule, when it was far behind of target, and when it was on the right track.
Uses:
- The Burndown chart illustrates by what speed the team members are working to finish a given task by plotting user stories against time in a graph.
- First of all, an ideal straight line is drawn with a negative slope as a reference giving the inverse relationship between backlog (remaining work) and time.
- Every day during the daily scrum the team will discuss how many story points they have accomplished in the previous day. Then draw the line by removing the number of story points completed sprint.
- Burndown will help the team to see very quickly whether they are on track or not.
- If after a couple of days, the team sees that they are above the ideal line they need to find a way to come back on track. Otherwise, they will not be able to finish their user stories.
- If they go below the ideal line that means they might finish their user stories before the end of the sprint and they can ask the product’s owner to take on another user story.
- It is never a straight line as the team can not work every day with the same velocity.
Advantages of Burndown Chart:
- We can see the total efforts a team puts against the given task from the graph.
- Burndown chart guides them to manage their tasks according to the time.
- Generally, software developers need a burn-down chart to estimate their efforts and pending works.
- It is useful as it provides insight into how the members are busy doing the work.
- Thus, every owner uses it to check the progress of the process of making a product.
- It works as a reminder and pokes the members if any project is delayed.
- It describes the period required to achieve the goal.
- It is a simple and easy way to check the progress of a project in scrum and agile management.
- Progress updates will keep the workers dedicated to their given tasks.
- Henceforth, it helps to finish everything before the deadline.
Disadvantages of Burndown Chart:
- In the burn-down chart, we can not see which user stories have been completed and whether that was the right user story or not. Only we can see the amount of work. So it is difficult to get a clear idea about specific user stories from the burn-down chart.
- The Burndown chart does not clarify the changes that occurred due to the increase or increase of any story points.
- From burn down, we can get the idea only on progress or lack but the progress is on the right track or not we can not get to know from it.
Difference between Burndown chart and Burn up chart:
The main difference between the burndown chart and the burnup chart is that the burndown chart represents how much work is left and the burnup chart represents how much work is completed. Let’s know more differences between these from the below table.
| 01. |
It says about the pending portion. |
It says about the completed portion. |
| 02. |
Progress is not steady throughout the project. |
Progress is steady throughout the project. |
| 03. |
Here, the Slope is negative. |
Here, the Slope is positive. |
| 04. |
It shows an inverse relationship between remaining work and time. |
It shows a direct relationship between completed work and time. |
| 05. |
Only a single line is used. |
Two lines are used. |
| 06. |
It gives a fast output. |
It gives a slow output. |
| 07. |
It ends at zero. |
It begins from zero. |
| 08. |
Estimation is done regularly. |
Estimation is done regularly. |
| 09. |
Scope creep is not easily visible. |
Scope creep is easily visible. |
| 10. |
It is preferable for fixed-scoped projects. |
It is not preferable. |
Like Article
Suggest improvement
Share your thoughts in the comments
Please Login to comment...