Overlay Density Plots in Base R
Last Updated :
17 Jun, 2021
In this article, we will discuss how to overlay density plot using some base functions of the R Programming Language. Overlaying density plots means creating some density plots of the different data over a single plot.
Functions Used
- Plot() : This is a generic function for plotting R objects.
Syntax:
plot(x, y, …)
Parameters:
- x: the coordinates of points in the plot.
- y: the y coordinates of points in the plot,
- …: Arguments to be passed to methods, such as graphical parameters
- Density(): This is a generic function density that computes kernel density estimates. Its default method does so with the given kernel and bandwidth for uni-variate observations.
Syntax:
density(x,…)
Parameters:
- x:-the data from which the estimate is to be computed.
- …:-further arguments for (non-default) methods.
Returns:
This function will be returning the density plot of the given data.
- Lines(): This is a generic function taking coordinates given in various ways and joining the corresponding points with line segments.
Syntax:
lines(x, …)
Parameters:
- x:-coordinate vectors of points to join.
- …:-Further graphical parameters
- R creates histogram using hist() function.
Syntax:
hist(v, main, xlab, xlim, ylim, breaks, col, border)
Parameters:
- v: This parameter contains numerical values used in histogram.
- main: This parameter main is the title of the chart.
- col: This parameter is used to set color of the bars.
- xlab: This parameter is the label for horizontal axis.
- border: This parameter is used to set border color of each bar.
- xlim: This parameter is used for plotting values of x-axis.
- ylim: This parameter is used for plotting values of y-axis.
- breaks: This parameter is used as width of each bar.
Overlaying two density plots may seem complex, but it is as simple as plotting a same density graph. For every other plot you just have to keep calling the function with their respective density and add their required mechanism to functions except the first one to keep drawing them on the same plot.
Example 1:
R
gfg <-rnorm(500)
a <- rnorm(200)
b <- rnorm(100)
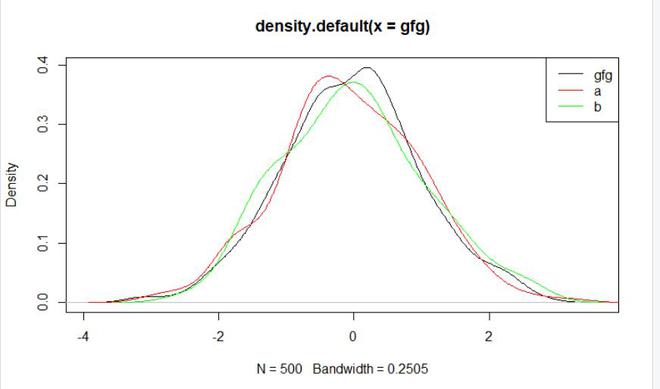
plot(density(gfg))
lines(density(a), col = "red")
lines(density(b), col = "green")
legend("topright", c("gfg", "a", "b"),
col =c("black","red","green"), lty=1)
|
Output:
Example 2:
R
set.seed(99990)
data<-data.frame(a=round(rnorm(1000,50,50)))
data2<-data.frame(b=round(rnorm(600,30,30)))
data3<-data.frame(c=round(rnorm(300,10,10)))
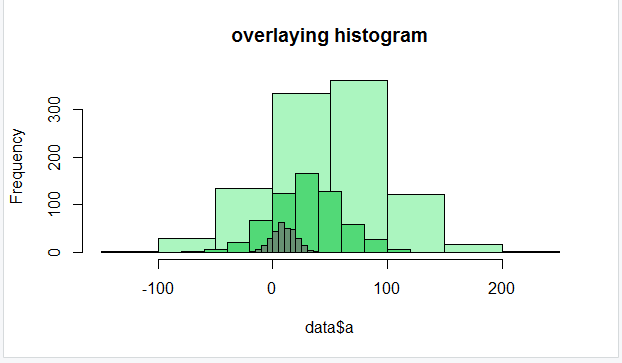
hist(data$a, col="#abf5bf",main="overlaying histogram")
hist(data2$b, col="#52d977", add=T)
hist(data3$c, col="#669172", add=T)
|
Output:
Like Article
Suggest improvement
Share your thoughts in the comments
Please Login to comment...