numpy.log1p() in Python
Last Updated :
29 Nov, 2018
numpy.log1p(arr, out = None, *, where = True, casting = ‘same_kind’, order = ‘K’, dtype = None, ufunc ‘log1p’) :
This mathematical function helps user to calculate natural logarithmic value of x+1 where x belongs to all the input array elements.
log1p is reverse of exp(x) – 1.
Parameters :
array    : [array_like]Input array or object.
out      : [ndarray, optional]Output array with same dimensions as
            Input array, placed with result.
**kwargs : allows you to pass keyword variable length of argument to a function.
           It is used when we want to handle named argument in a function.
where    : [array_like, optional]True value means to calculate the universal
           functions(ufunc) at that position, False value means to leave the
           value in the output alone.
Return :
An array with natural logarithmic value of x + 1;
where x belongs to all elements of input array.
Code 1 : Working
import numpy as np
in_array = [1, 3, 5]
print ("Input array : ", in_array)
out_array = np.log1p(in_array)
print ("Output array : ", out_array)
|
Output :
Input array :  [1, 3, 5]
Output array :  [ 0.69314718  1.38629436  1.79175947]
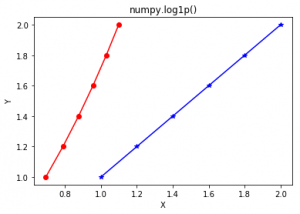
Code 2 : Graphical representation
import numpy as np
import matplotlib.pyplot as plt
in_array = [1, 1.2, 1.4, 1.6, 1.8, 2]
out_array = np.log1p(in_array)
print ("out_array : ", out_array)
y = [1, 1.2, 1.4, 1.6, 1.8, 2]
plt.plot(in_array, y, color = 'blue', marker = "*")
plt.plot(out_array, y, color = 'red', marker = "o")
plt.title("numpy.log1p()")
plt.xlabel("X")
plt.ylabel("Y")
plt.show()
|
Output :
out_array : [ 0.69314718 0.78845736 0.87546874 0.95551145 1.02961942 1.09861229]
References :
https://docs.scipy.org/doc/numpy-1.13.0/reference/generated/numpy.exp.html
.
Like Article
Suggest improvement
Share your thoughts in the comments
Please Login to comment...