NumPy linspace() Method | Create Evenly Spaced Array
Last Updated :
02 Feb, 2024
The NumPy.linspace() function returns an array of evenly spaced values within the specified interval [start, stop].
It is similar to NumPy.arange() function but instead of a step, it uses a sample number.
Syntax
Synatx: numpy.linspace(start, stop, num=50, endpoint=True , retstep=False, dtype=None, axis=0)
Parameters:
- start: [optional] start of interval range. By default start = 0
- stop: end of interval range
- num: [int, optional] No. of samples to generate
- retstep: If True, Stop is the last sample By default restep = False
- endpoint: If True, stop is included as the last value. If False, stop is excluded. By default endpoint=True.
- dtype: type of output array
- axis: If start and stop are arrays, axis specifies on what axis will the values be added. If axis = 0, value is added to front, if axis = -1 value is added at the end.
Return:
- ndarray
- step : [float, optional], if restep = True
Examples
Let’s look at different examples on how to create equally spaced arrays with linspace() method of NumPy library in Python.
Example 1:
Python
import numpy as geek
print("B\n", geek.linspace(2.0, 3.0, num=5, retstep=True), "\n")
x = geek.linspace(0, 2, 10)
print("A\n", geek.sin(x))
|
Output :
B
 (array([ 2.  ,  2.25,  2.5 ,  2.75,  3.  ]), 0.25)
A
 [ 0.          0.22039774  0.42995636  0.6183698   0.77637192  0.8961922
  0.9719379   0.99988386  0.9786557   0.90929743]
Example 2:
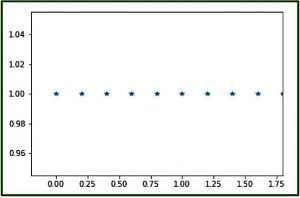
Here we will see graphical representation of numpy.linspace() using matplotlib module – pylab
Python
import numpy as geek
import pylab as p
x1 = geek.linspace(0, 2, 10, endpoint = False)
y1 = geek.ones(10)
p.plot(x1, y1, '*')
p.xlim(-0.2, 1.8)
|
Output :
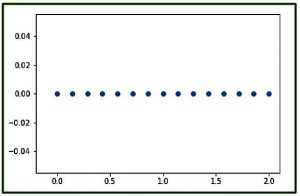
Example 3:
Graphical Representation of numpy.linspace() using pylab
Python
import numpy as geek
import pylab as p
x1 = geek.linspace(0, 2, 15, endpoint = True)
y1 = geek.zeros(15)
p.plot(x1, y1, 'o')
p.xlim(-0.2, 2.1)
|
Output :
The linspace() method of the NumPy library is a useful tool to generate sequences of data points. It is also used in data visualization. It has a lot of scientific and mathematical applications.
In this tutorial, we have explained the linspace() method in easy words with examples. After reading this guide we now know what the linspace() function is, what it does, and how to use it.
Like Article
Suggest improvement
Share your thoughts in the comments
Please Login to comment...