numpy.arcsinh() in Python
Last Updated :
29 Nov, 2018
numpy.arcsinh() : This mathematical function helps user to calculate inverse hyperbolic sine, element-wise for all arr.
Syntax : numpy.arcsinh(arr, /, out=None, *, where=True, casting=’same_kind’, order=’K’, dtype=None, ufunc ‘arcsinh’)
Parameters :
arr : array_like
Input array.
out : [ndarray, optional] A location into which the result is stored.
-> If provided, it must have a shape that the inputs broadcast to.
-> If not provided or None, a freshly-allocated array is returned.
where : array_like, optional
Values of True indicate to calculate the ufunc at that position, values of False indicate to leave the value in the output alone.
**kwargs :Allows to pass keyword variable length of argument to a function. Used when we want to handle named argument in a function.
Return : An array with inverse hyperbolic sine of arr
for all arr i.e. array elements.
Note :
2pi Radians = 360 degrees
The convention is to return the angle of arr whose imaginary part lies in [-pi/2, pi/2].
Code #1 : Working
import numpy as np
in_array = [2, 1, 10, 100]
print ("Input array : \n", in_array)
arcsinh_Values = np.arcsinh(in_array)
print ("\nInverse hyperbolic sine values of input array : \n", arcsinh_Values)
|
Output :
Input array :
 [2, 1, 10, 100]

Inverse hyperbolic sine values of input array :
 [ 1.44363548  0.88137359  2.99822295  5.29834237]
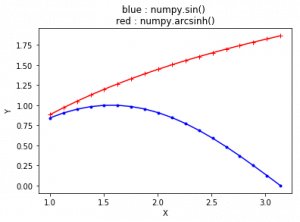
Code #2 : Graphical representation
import numpy as np
import matplotlib.pyplot as plt
in_array = np.linspace(1, np.pi, 18)
out_array1 = np.sin(in_array)
out_array2 = np.arcsinh(in_array)
print("in_array : ", in_array)
print("\nout_array with sin : ", out_array1)
print("\nout_array with arcsinh : ", out_array2)
plt.plot(in_array, out_array1,
color = 'blue', marker = ".")
plt.plot(in_array, out_array2,
color = 'red', marker = "+")
plt.title("blue : numpy.sin() \nred : numpy.arcsinh()")
plt.xlabel("X")
plt.ylabel("Y")
|
Output :
in_array :  [ 1.          1.12597604  1.25195208  1.37792812  1.50390415  1.62988019
  1.75585623  1.88183227  2.00780831  2.13378435  2.25976038  2.38573642
  2.51171246  2.6376885   2.76366454  2.88964058  3.01561662  3.14159265]

out_array with sin :  [  8.41470985e-01   9.02688009e-01   9.49598344e-01   9.81458509e-01
   9.97763553e-01   9.98255056e-01   9.82925230e-01   9.52017036e-01
   9.06020338e-01   8.45664137e-01   7.71905017e-01   6.85911986e-01
   5.89047946e-01   4.82848093e-01   3.68995589e-01   2.49294878e-01
   1.25643097e-01   1.22464680e-16]

out_array with arcsinh :  [ 0.88137359  0.96770792  1.04881189  1.12508571  1.1969269   1.26471422
  1.32879961  1.38950499  1.44712201  1.50191335  1.55411486  1.60393799
  1.65157228  1.69718777  1.74093713  1.78295772  1.82337333  1.86229574]
Like Article
Suggest improvement
Share your thoughts in the comments
Please Login to comment...