Multiplots in Python using Matplotlib
Last Updated :
12 May, 2022
Matplotlib is a Python library that can be used for plotting graphs and figures. Plotting multiplots or multiple plots are often required either for comparing the two curves or show some gradual changes in the multiple plots, and this can be done using Subplots. Subplots are one of the most important and fundamental concepts to be understood while trying to plot multiple figures/graphs/plots in the same, and this tutorial shows you how it is done. The subplot() function can be found in the pyplot module of matplotlib, which provides a MATLAB-like framework for plotting in Python. The function’s prototype is as shown below:
matplotlib.pyplot.subplot(nrows, ncols, index)
There are also certain keyword arguments that can be given.
The Stacked Plots
First, let’s try to plot a sequence of plots (3 here) by stacking one over the other. As we are stacking them, it’s the number of rows (nrows) that change, meaning ncols stay the same as 1. Each subplot is identified by the index parameter.
Python3
import matplotlib.pyplot as plt
import numpy as np
x = np.arange(0, 10, 0.01)
plt.subplot(3, 1, 1)
plt.plot(x, np.sin(x))
plt.subplot(3, 1, 2)
plt.plot(x, np.cos(x))
plt.subplot(3, 1, 3)
plt.plot(x, x)
plt.show()
|
Output: 
Grid Plots
Next, we’ll try to plot some graphs as a grid, that is, multiplots with multiple columns. Here, we will create a multiplot with 4 plots, we will make it a 2×2 grid, which means nrows=2 and ncols=2, with each image being identified by the index again, in a row-major order.
Python3
import matplotlib.pyplot as plt
import numpy as np
x = np.arange(0, 10, 0.01)
plt.subplot(2, 2, 1)
plt.plot(x, np.sin(x))
plt.subplot(2, 2, 2)
plt.plot(x, np.cos(x))
plt.subplot(2, 2, 3)
plt.plot(x, x)
plt.subplot(2, 2, 4)
plt.plot(x, 5-x)
plt.show()
|
Output:  If we were to create a multiplot where one plot overlaps over the other one, kind of like what we see when we minimize a youtube video but it still runs in a small window at the bottom corner, then the add_suplplot() function helps in this.
Python3
import matplotlib.pyplot as plt
import numpy as np
fig = plt.figure()
x = np.arange(0, 10, 0.01)
plt.plot(x, x-5)
plt.title("Not so Tiny")
fig.add_subplot(2, 2, 4)
plt.plot(x, 5-x)
plt.title("Tiny Plot")
plt.show()
|
Output: 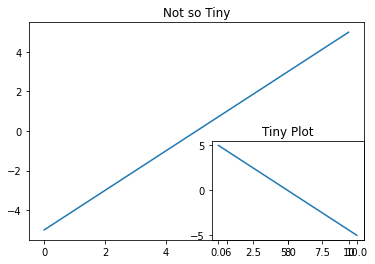 Oh, and also, for all the subplot functions that we’ve implemented, if nrows, ncols, and index are less than 10, instead of giving the arguments in the (nrows, ncols, index) format, they can be passed as a three-digit in the format (nrows*100+ncols*10+index), and the output would remain the same. Why don’t we try it out with the Grid Plots?
Python3
import matplotlib.pyplot as plt
import numpy as np
x = np.arange(0, 10, 0.01)
plt.subplot(221)
plt.plot(x, np.sin(x))
plt.subplot(222)
plt.plot(x, np.cos(x))
plt.subplot(223)
plt.plot(x, x)
plt.subplot(224)
plt.plot(x, 5-x)
plt.show()
|
Output:
The output still remains the same even if we use the three-digit format of passing the arguments.
Like Article
Suggest improvement
Share your thoughts in the comments
Please Login to comment...