Multiple Line Plots or Time Series Plots with ggplot2 in R
Last Updated :
24 Oct, 2021
In this article, we will discuss how to plot Multiple Line Plots or Time Series Plots with the ggplot2 package in the R Programming Language. We can create a line plot using the geom_line() function of the ggplot2 package.
Syntax:
ggplot( df, aes( x, y ) ) + geom_line()
where,
- df: determines the dataframe used
- x and y: determines the axis variables
Example:
Here, is a basic line plot made using the geom_line() function of the ggplot2 package. Here, the dataset used is the city crime dataset from 1975 to 2015 which can be downloaded from ucr_crime.
R
library(tidyverse)
sample_data <- read_csv("ucr_crime_1975_2015.csv")
ggplot(sample_data, aes(x=year, violent_per_100k)) +
geom_line()
|
Output:
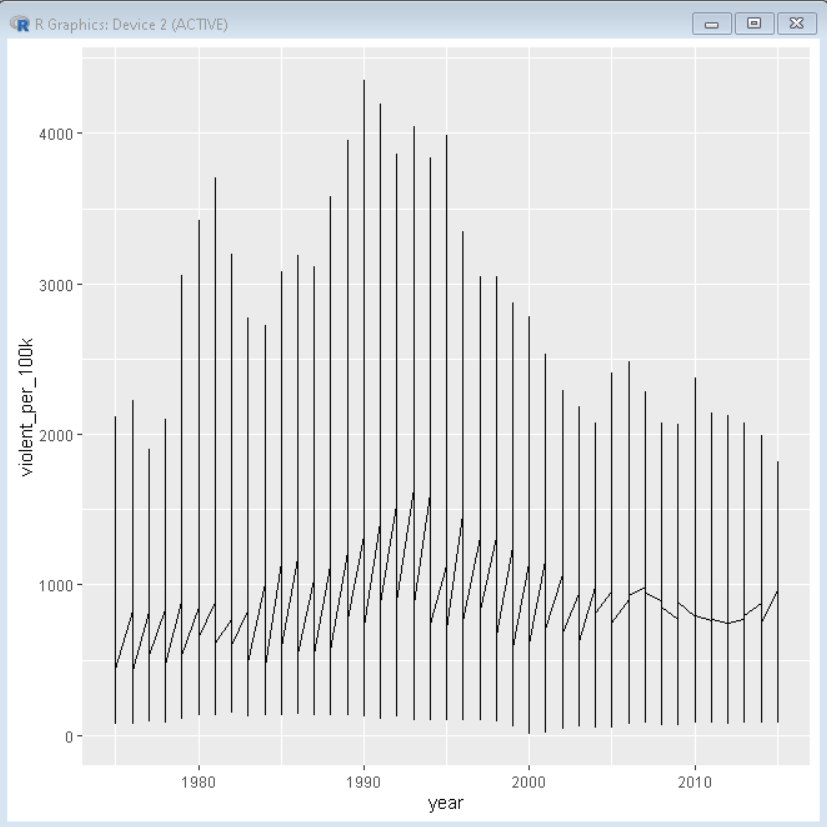
Here, the resulting plot doesn’t look like multiple time series. It is because for a multiple time series in the above example we just used two variables and those two are needed for a single time series plot. To get a multiple time series plot we need one more differentiating variable. So we will use the color parameters to group and color the line plot according to another variable of differentiating caliber.
Syntax:
ggplot( df, aes( x, y, color ) ) + geom_line()
where,
- df: determines the data frame used
- x and y: determines the axis variable
- color: determines the variable according to which plot is grouped and colored
Example:
Here, is a basic line plot made using the geom_line() function of the ggplot2 package. Here we have grouped and colored the plot according to department_name. This creates the necessary three differentiating variables for multiple time series.
R
library(tidyverse)
sample_data <- read_csv("ucr_crime_1975_2015.csv")
ggplot(sample_data, aes(x=year, violent_per_100k, color=department_name)) +
geom_line()+
theme(legend.position = "none")
|
Output:

Like Article
Suggest improvement
Share your thoughts in the comments
Please Login to comment...