Multiple Density Plots with Pandas in Python
Last Updated :
03 Jan, 2021
Multiple density plots are a great way of comparing the distribution of multiple groups in your data. We can make multiple density plots using pandas plot.density() function. However, we need to convert data in a wide format if we are using the density function. Wide data represents different groups in different columns. We convert data in a wide format using Pandas pivot() function.
Let’s create the simple data-frame and then reshape it into a wide-format:
Example 1:
Here we are using this data set.
Step 1: Creating dataframe from data set.
Python3
import pandas as pd
df = pd.read_csv(r"gapminder1.csv")
df.head()
|
Output:
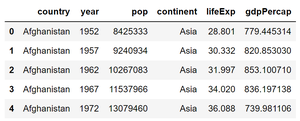
dataset
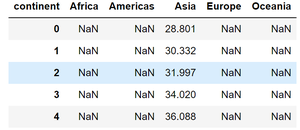
Step 2: Let’s group data according to countries in different columns so that we can apply the density() function to plot multiple density plots.
Python3
data_wide = df.pivot(columns='continent',
values='lifeExp')
data_wide.head()
|
Output:
Step 3: Now let’s plot multiple density plot using plot.density()
Python3
import matplotlib.pyplot as plt
data_wide.plot.density(figsize = (7, 7),
linewidth = 4)
plt.xlabel("life_Exp")
|
Output :

Multiple density plots
Example 2: We can also call plot.kde() function on dataframe to make multiple density plots with Pandas.
Here we are using the tips dataset for this example, You can find it here.
Step 1: Creating dataframe from data set.
Python3
import pandas as pd
df = pd.read_csv(r"tips.csv")
df.head()
|
Output:
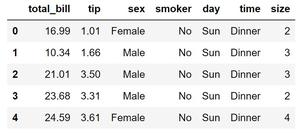
tips_df
Step 2: Now apply pivot() function to have dataframe in the wide-format then apply kde() to have multiple density plot.
Python3
data_wide = df.pivot(columns = 'day',
values = 'total_bill')
data_wide.plot.kde(figsize = (8, 6),
linewidth = 4)
|
Output:
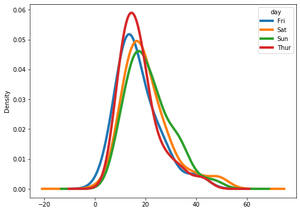
tips multiple D.P
Share your thoughts in the comments
Please Login to comment...