ML | V-Measure for Evaluating Clustering Performance
Last Updated :
12 Apr, 2023
One of the primary disadvantages of any clustering technique is that it is difficult to evaluate its performance. To tackle this problem, the metric of V-Measure was developed. The calculation of the V-Measure first requires the calculation of two terms:-
- Homogeneity: A perfectly homogeneous clustering is one where each cluster has data-points belonging to the same class label. Homogeneity describes the closeness of the clustering algorithm to this perfection.
- Completeness: A perfectly complete clustering is one where all data-points belonging to the same class are clustered into the same cluster. Completeness describes the closeness of the clustering algorithm to this perfection.
Trivial Homogeneity: It is the case when the number of clusters is equal to the number of data points and each point is in exactly one cluster. It is the extreme case when homogeneity is highest while completeness is minimum. 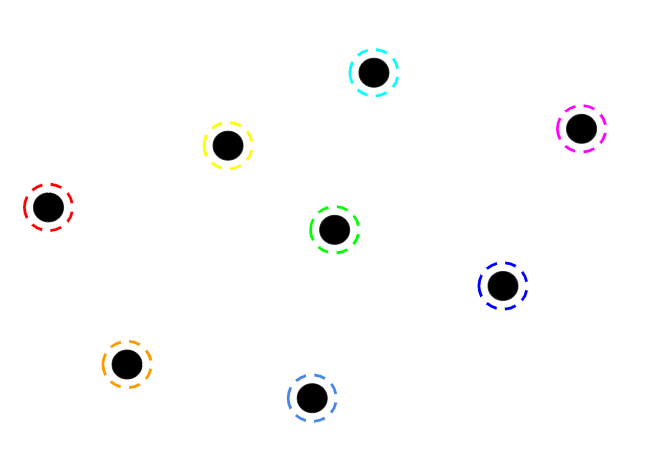 Trivial Completeness: It is the case when all the data points are clustered into one cluster. It is the extreme case when homogeneity is minimum and completeness is maximum.
 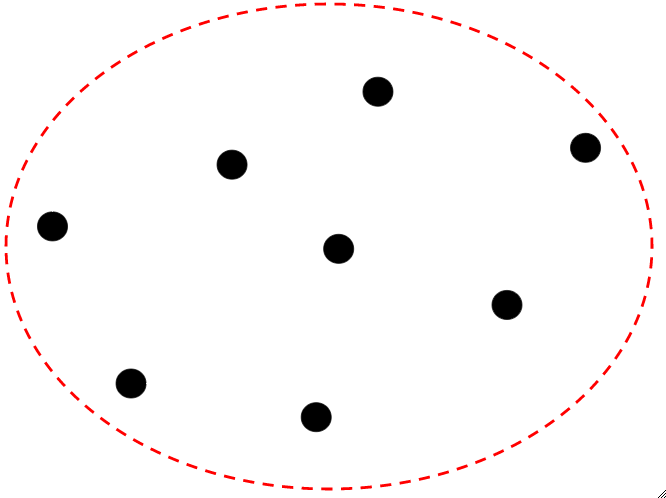 Assume that each data point in the above diagrams is of the different class label for Trivial Homogeneity and Trivial Completeness. Note: The term homogeneous is different from completeness in the sense that while talking about homogeneity, the base concept is of the respective cluster which we check whether in each cluster does each data point is of the same class label. While talking about completeness, the base concept is of the respective class label which we check whether data points of each class label is in the same cluster.
 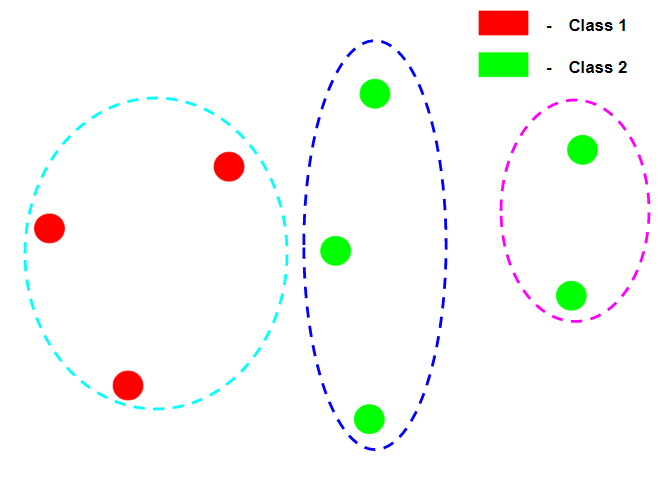 In the above diagram, the clustering is perfectly homogeneous since in each cluster the data points of are of the same class label but it is not complete because not all data points of the same class label belong to the same class label.
 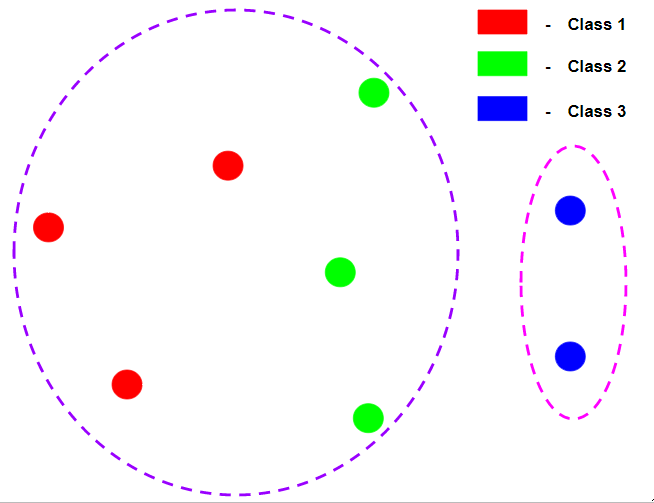 In the above diagram, the clustering is perfectly complete because all data points of the same class label belong to the same cluster but it is not homogeneous because the 1st cluster contains data points of many class labels. Let us assume that there are N data samples, C different class labels, K clusters and
  number of data-points belonging to the class c and cluster k. Then the homogeneity h is given by the following:-
  where
where  and
and  The completeness c is given by the following:-
  where
where  and
and  Thus the weighted V-Measure
  is given by the following:-
  The factor
  can be adjusted to favour either the homogeneity or the completeness of the clustering algorithm. The primary advantage of this evaluation metric is that it is independent of the number of class labels, the number of clusters, the size of the data and the clustering algorithm used and is a very reliable metric. The following code will demonstrate how to compute the V-Measure of a clustering algorithm. The data used is the Detection of Credit Card Fraud which can be downloaded from Kaggle. The clustering algorithm used is the Variational Bayesian Inference for Gaussian Mixture Model. Step 1: Importing the required libraries
Python3
import pandas as pd
import matplotlib.pyplot as plt
from sklearn.cluster import KMeans
from sklearn.metrics import v_measure_score
|
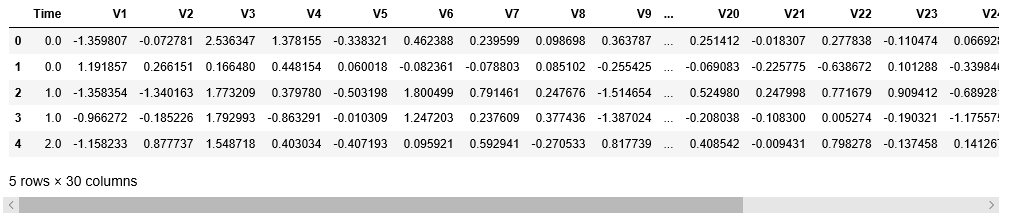
Step 2: Loading and Cleaning the data
Python3
cd C:\Users\Dev\Desktop\Kaggle\Credit Card Fraud
df = pd.read_csv('creditcard.csv')
y = df['Class']
X = df.drop('Class', axis = 1)
X.head()
|
 Step 3: Building different clustering models and comparing their V-Measure scores In this step, 5 different K-Means Clustering Models will be built with each model clustering the data into a different number of clusters.
Python3
v_scores = []
N_Clusters = [2, 3, 4, 5, 6]
|
a) n_clusters = 2
Python3
kmeans2 = KMeans(n_clusters = 2)
kmeans2.fit(X)
labels2 = kmeans2.predict(X)
v_scores.append(v_measure_score(y, labels2))
|
b) n_clusters = 3
Python3
kmeans3 = KMeans(n_clusters = 3)
kmeans3.fit(X)
labels3 = kmeans3.predict(X)
v_scores.append(v_measure_score(y, labels3))
|
c) n_clusters = 4
Python3
kmeans4 = KMeans(n_clusters = 4)
kmeans4.fit(X)
labels4 = kmeans4.predict(X)
v_scores.append(v_measure_score(y, labels4))
|
d) n_clusters = 5
Python3
kmeans5 = KMeans(n_clusters = 5)
kmeans5.fit(X)
labels5 = kmeans5.predict(X)
v_scores.append(v_measure_score(y, labels5))
|
e) n_clusters = 6
Python3
kmeans6 = KMeans(n_clusters = 6)
kmeans6.fit(X)
labels6 = kmeans6.predict(X)
v_scores.append(v_measure_score(y, labels6))
|
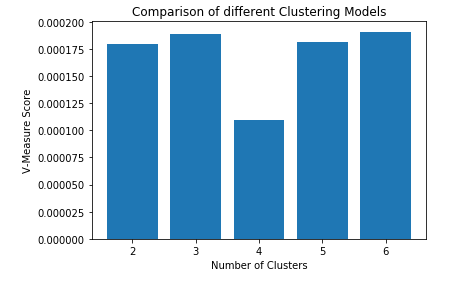
Step 4: Visualizing the results and comparing the performances
Python3
plt.bar(N_Clusters, v_scores)
plt.xlabel('Number of Clusters')
plt.ylabel('V-Measure Score')
plt.title('Comparison of different Clustering Models')
plt.show()
|
Like Article
Suggest improvement
Share your thoughts in the comments
Please Login to comment...