ML | Adjusted R-Square in Regression Analysis
Last Updated :
29 Sep, 2021
Prerequisite: Linear Regression, R-square in Regression
Why Adjusted-R Square Test:
R-square test is used to determine the goodness of fit in regression analysis. Goodness of fit implies how better regression model is fitted to the data points. More is the value of r-square near to 1, better is the model. But the problem lies in the fact that the value of r-square always increases as new variables(attributes) are added to the model, no matter that the newly added attributes have a positive impact on the model or not. also, it can lead to overfitting of the model if there are large no. of variables.
Adjusted r-square is a modified form of r-square whose value increases if new predictors tend to improve model’s performance and decreases if new predictors do not improve performance as expected.
For better understanding consider :
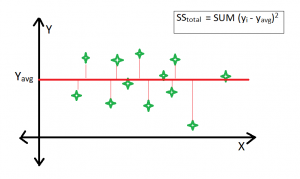
Average Fitted Line
Best Fitted Line :
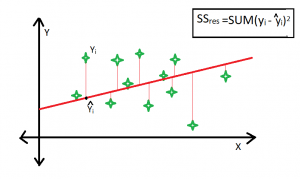
R-square formula:
Clearly, SStot is always fixed for some data points if new predictors are added to the model, but value of SSres decreases as model tries to find some correlations from the added predictors. Hence, r-square’s value always increases.
Adjusted R-Square :
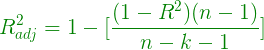
Adjusted R-Square
Here, k is the no. of regressors and n is the sample size.
if the newly added variable is good enough to improve model’s performance, then it will overwhelm the decrease due to k. Otherwise, an increase in k will decrease adjusted r-square value.
Example-
Case #1:
Python3
import pandas as pd
import numpy as np
s = pd.read_csv('Salary_Data.csv')
f = np.ones((30, 1))
s.insert(0, 'extra', f)
import statsmodels.formula.api as sm
X_opt = s.iloc[:, :-1]
Y1 = s.iloc[:, -1]
regressor_OLS = sm.OLS(endog = Y1, exog = X_opt).fit()
regressor_OLS.summary()
|
Output :
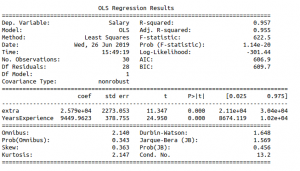
Summary Table
Case #2:
Python3
import pandas as pd
import numpy as np
s = pd.read_csv('Salary_Data.csv')
f = np.ones((30, 1))
s.insert(0, 'extra', f)
g =[]
for i in range(1, 31):
g.append(i)
s.insert(2, 'Id', g)
import statsmodels.formula.api as sm
X_opt = s.iloc[:, :-1]
Y1 = s.iloc[:, -1]
regressor_OLS = sm.OLS(endog = Y1, exog = X_opt).fit()
regressor_OLS.summary()
|
Output :
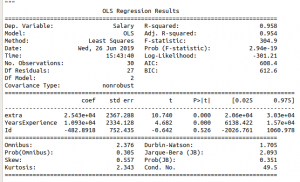
Summary Table
Explanation –
R-square value and adjusted r-square value 0.957, 0.955 respectively. But when an attribute Id is added, which is an irrelevant attribute, gives r-square and adjusted r-square equal to 0.958, 0.954 respectively.
Hence on adding an irrelevant attribute in the dataset, the value of r-square increases(from 0.957 to 0.958). But value of adjusted r-square decreases(from 0.955 to 0.954).
Share your thoughts in the comments
Please Login to comment...