Microsoft Azure – Tracking Memory Utilization of Azure VM using KQL Log Query
Last Updated :
03 Apr, 2023
In this article, we will look into the process of finding the Minimum, Average, and Maximum Memory Utilization of all Azure Virtual Machines using KQL Log Query. Here we are Perf KQL Counter Operator which is used to find Azure Virtual Machines performance from collected data logs.
Implementation:
Follow the below steps to Run the Log Queries.
Step 1: Log in to Azure Portal.
Step 2: Search/Go to Log Analytics Workspace and select your Log Analytics Workspace. Create one if you don’t have any and enable agent configurations.
- Then, from the left menu navigate to General >> Logs
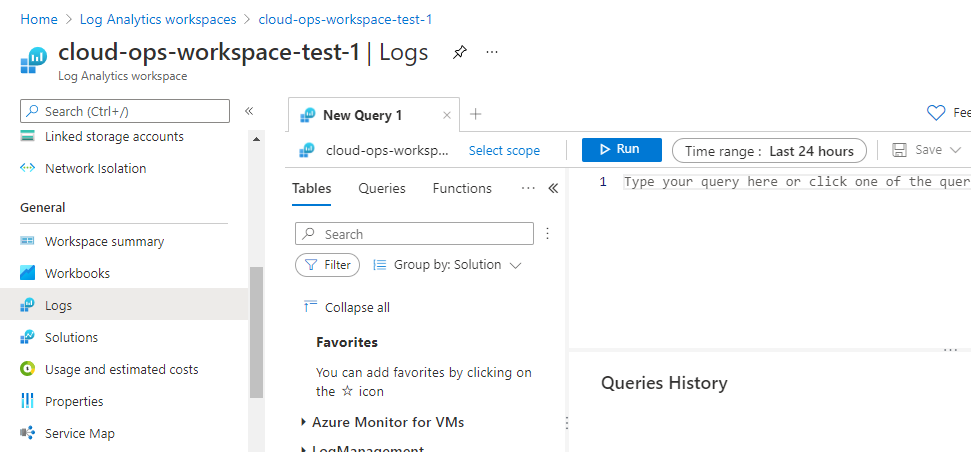
- Now, Paste the below Queries to get the log data.
- Before Running the Query understand the Query Syntax.
Explanation for all the below examples :
Here, Perf represents performance, this is an operator which is used to fetch the performance logs of Azure Compute resources like Azure VMs, SQL Servers, Disk Storage,…etc.
We are using the ObjectName == “Memory” and CounterName == “% Committed Bytes In Use” (To calculate the Windows Metrics) and CounterName == “% Used Memory” (To calculate the Linux Metrics) these conditions filters the memory performance components of Windows and Linux VMs using a where keyword.
TimeGenerated > ago(7d) or TimeGenerated > ago(5h) helps in filter the logs collected within that timespan.
With the summarize keyword we are rendering the required data in the form of a table chart.
Find the following KQL Queries for Analysing Memory Performance of Azure VMs.
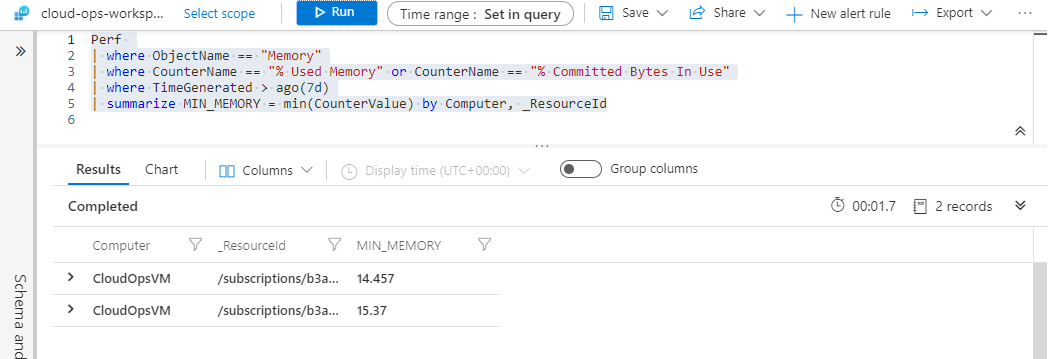
Example: To find Minimum Memory Utilization of Azure Virtual Machines for last 7 days
Perf
| where ObjectName == "Memory"
| where CounterName == "% Used Memory" or CounterName == "% Committed Bytes In Use"
| where TimeGenerated > ago(7d)
| summarize MIN_MEMORY = min(CounterValue) by Computer, _ResourceId
Output:
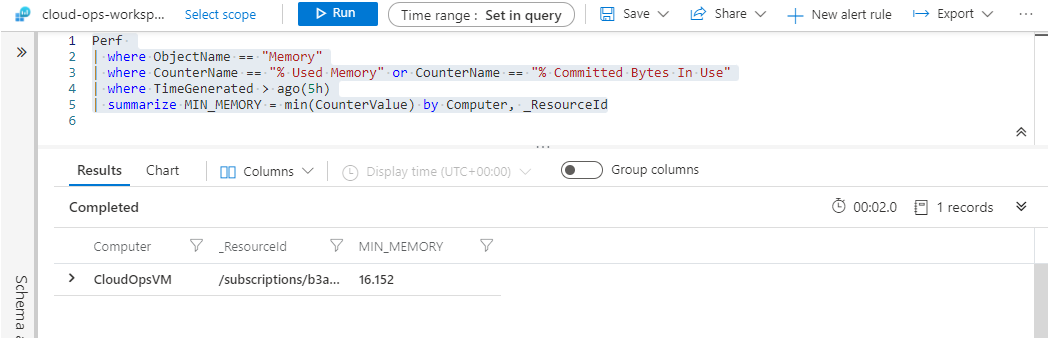
Example: To find Minimum Memory Utilization of Azure Virtual Machines for the last 5 hours
Perf
| where ObjectName == "Memory"
| where CounterName == "% Used Memory" or CounterName == "% Committed Bytes In Use"
| where TimeGenerated > ago(5h)
| summarize MIN_MEMORY = min(CounterValue) by Computer, _ResourceId
Output:
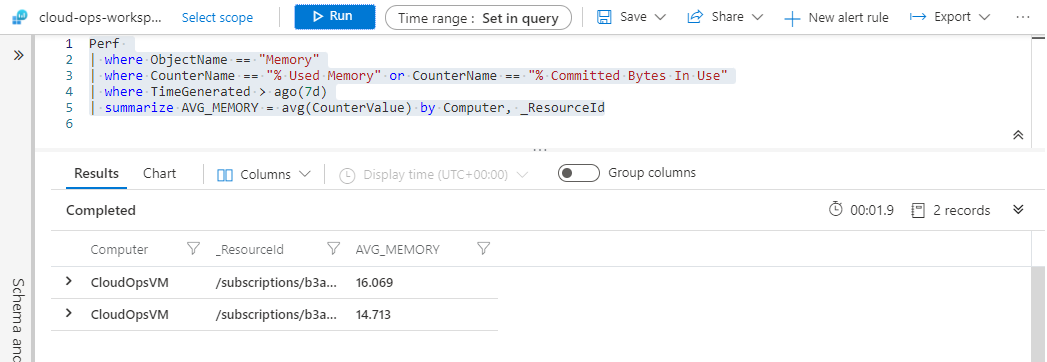
Example 1: To find Average Memory Utilization of Azure Virtual Machines for the last 7 days.
Perf
| where ObjectName == "Memory"
| where CounterName == "% Used Memory" or CounterName == "% Committed Bytes In Use"
| where TimeGenerated > ago(7d)
| summarize AVG_MEMOERY= avg(CounterValue) by Computer, _ResourceId
Output:
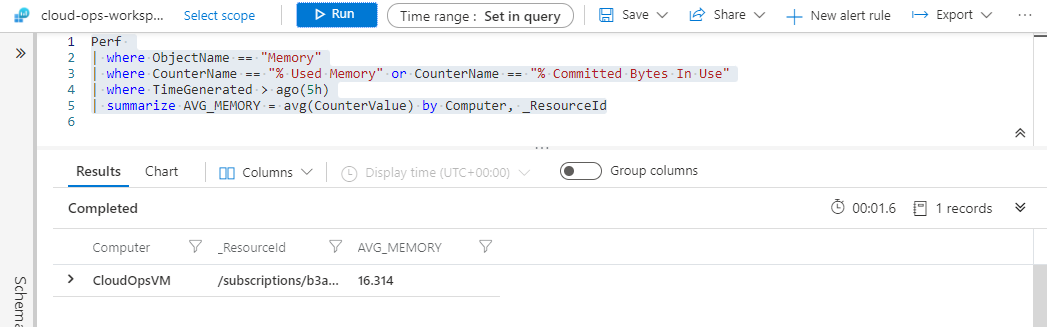
Example 2: To find Average Memory Utilization of Azure Virtual Machines for the last 5 hours
Perf
| where ObjectName == "Memory"
| where CounterName == "% Used Memory" or CounterName == "% Committed Bytes In Use"
| where TimeGenerated > ago(7d)
| summarize AVG_MEMOERY= avg(CounterValue) by Computer, _ResourceId
Output:
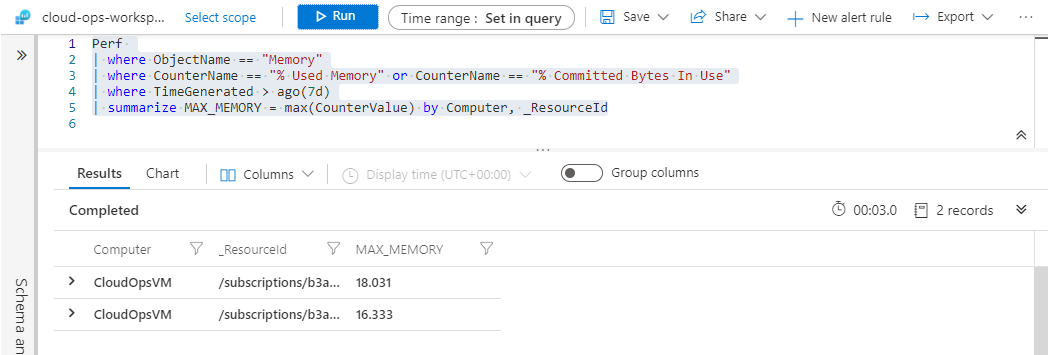
Example 3: To find Maximum Memory Utilization of Azure Virtual Machines for the last 7 days
Perf
| where ObjectName == "Memory"
| where CounterName == "% Used Memory" or CounterName == "% Committed Bytes In Use"
| where TimeGenerated > ago(7d)
| summarize MAX_MEMORY = max(CounterValue) by Computer,  _ResourceId
Output:
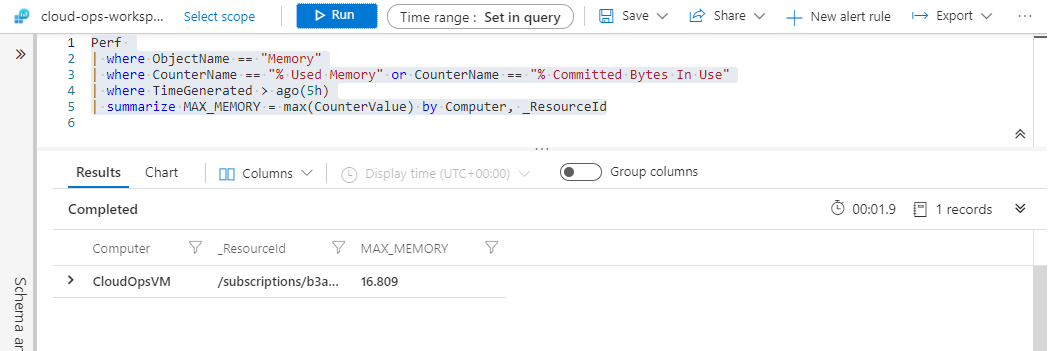
Example 4: To find Maximum Memory Utilization of Azure Virtual Machines for last 5 hours
Perf
| where ObjectName == "Memory"
| where CounterName == "% Used Memory" or CounterName == "% Committed Bytes In Use"
| where TimeGenerated > ago(5h)
| summarize  MAX_MEMORY = max(CounterValue) by Computer,  _ResourceId
Output:
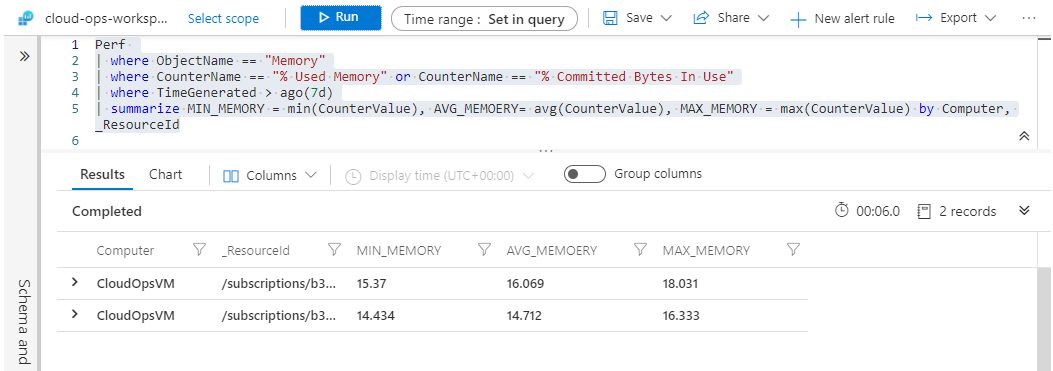
Example 5: To analyze VM Memory Utilization of Minimum, Average and Maximum for last 7 days in a single table chart.
Perf
| where ObjectName == "Memory"
| where CounterName == "% Used Memory" or CounterName == "% Committed Bytes In Use"
| where TimeGenerated > ago(7d)
| summarize MIN_MEMORY = min(CounterValue), AVG_MEMOERY= avg(CounterValue), MAX_MEMORY = max(CounterValue) by Computer,  _ResourceId
Output:
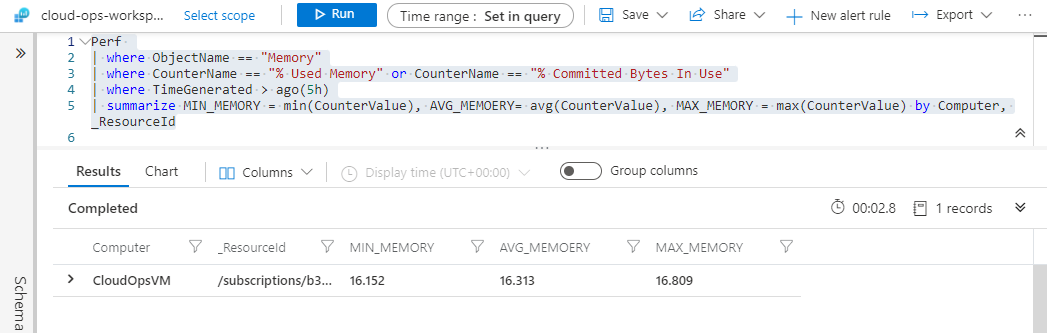
Example 6: To analyze VM Memory Utilization of Minimum, Average and Maximum for last 5 hours in a single table chart.
Perf
| where ObjectName == "Memory"
| where CounterName == "% Used Memory" or CounterName == "% Committed Bytes In Use"
| where TimeGenerated > ago(5h)
| summarize MIN_MEMORY = min(CounterValue), AVG_MEMOERY= avg(CounterValue), MAX_MEMORY = max(CounterValue) by Computer,  _ResourceId
Output:
That’s it, you are done.
Like Article
Suggest improvement
Share your thoughts in the comments
Please Login to comment...