Microsoft Azure – Debugging Azure Functions using VS Code
Last Updated :
30 Mar, 2023
In this article, we will learn how to debug Azure functions with Visual Studio Code. To start debugging Azure functions inside of Visual Studio Code, all you need to do is start off by creating a breakpoint, and now we’ll just engage the debugging session.
To do so follow the below steps:
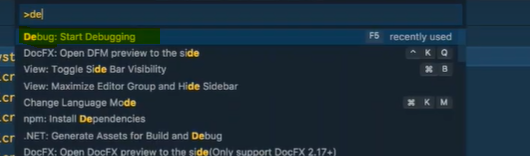
Step 1: First, in the command palette, we’ll hit “Start debug“.
And now what we should be seeing inside of our terminal window is that the Visual Studio Code extension is now booting the Azure functions runtime. It’s going to load our function up and prepare it to be ready to be debugged.
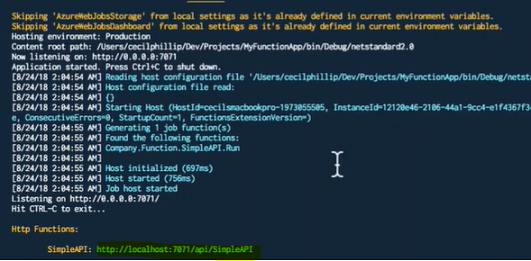
If we take a look at the bottom, we can see that our HTTP function is running at the URL.
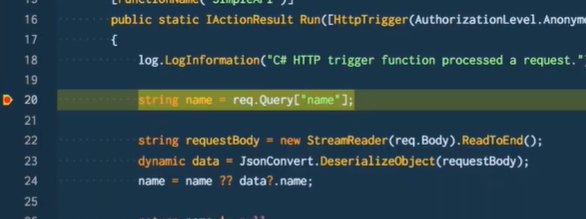
Step 2: Now, we are going to open up our web browser, and we are just going to paste this URL inside of the address bar. Notice how our breakpoint has been hit, and now we can step through the function and see exactly what’s happening there.
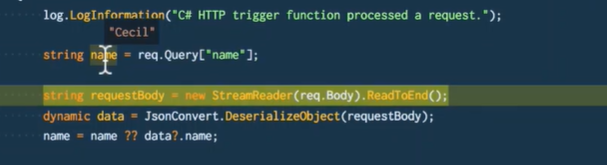
If we go to the debug section, notice that we have our local variables, and we can also see the call stack.
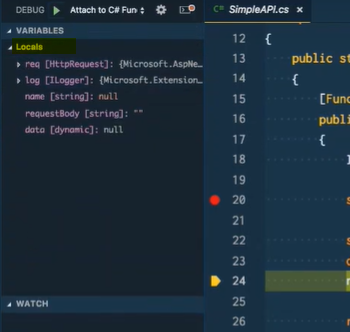
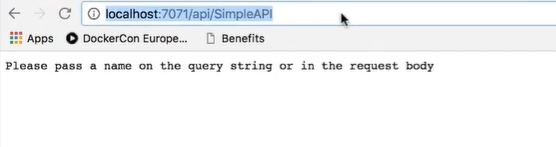
If we wanted to, we can even watch particular variables within our function contexts. If we go ahead and let this run, back in the browser, you can see it says, “Pass a name on the query string or in the request body.”
Step 3: So we need to put names equal to Cecil.
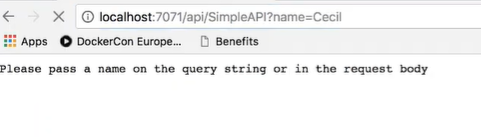
Again, notice that this is caught again by our debugger. If we put our mouse over the name variable, you could see that we are getting the value back from our query string that we pass them.
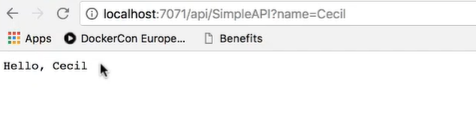
We can keep running this, and now back inside of our browser it now says, “Hello, Cecil.”
That’s how easy it is for you to start debugging your Azure functions inside of Visual Studio Code.
Like Article
Suggest improvement
Share your thoughts in the comments
Please Login to comment...