Microsoft Azure – Configuring an Alert Rule with Azure Monitor
Last Updated :
30 Mar, 2023
The azure monitor is a powerful monitoring tool that works like a smart dashboard for our applications and services by collecting application, guest operating system(OS), Azure resource, Azure subscription, and Azure tenant monitoring data to help us gain insights, understand the performance of our cloud and on-premise applications and services to easily identify issues that might affect them and know the factors and resources they depend on.
It helps us gain application, virtual machines(VM), container insights, respond to critical situations, and metric thresholds set by us, using alert and auto-scale features. It also provides us with different options to visualize, integrate the data that is being monitored, and export it if required.
Alerts in Azure monitor :
Alerts in Azure monitor uses the data collected by Azure monitor from our application and services to notify the administrators when an anomaly or issues based on certain thresholds are found. This helps us in taking the correct measure to fix the issue before the end-user gets to know about it.
The key attributes of an alert in Azure Monitor are :
- Target resource
- Criteria
- Signal
- Alert name
- Severity
- Alert description
- Action
Using these key attributes we can create an alert to notify us of different metrics and logs from the target resource we choose.
Creating alerts with Microsoft Azure portal :
Azure portal is an easy-to-use web-based user interface that helps to create, manage, deploy and use Azure resources effectively.
Prerequisites :
You need to have an active Azure Subscription. You can avail of a free 12-month subscription from here.
After you have signed in to your account follow the simple steps below to have your alerts ready :
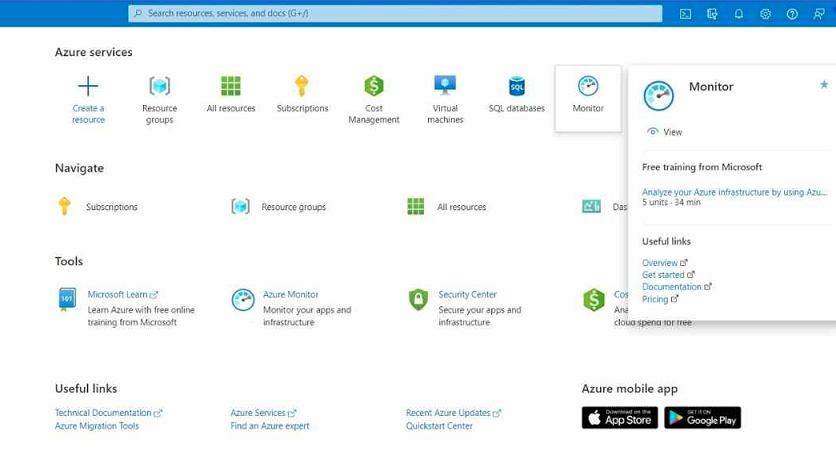
- We will be on the Azure homepage. Click on Monitor which puts together all the data from applications and services with the monitoring settings in one view.
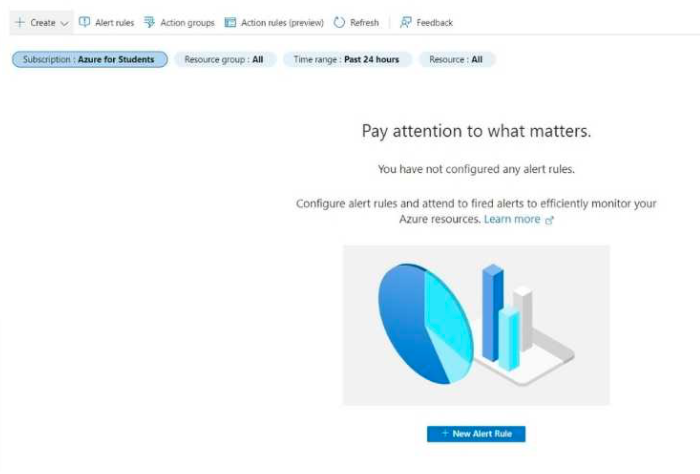
- To create a new alert click the Alerts option and then click + New alert rule.
- Next, to select a target resource that we wish to be alerted on , click Select target. In the search bar, we can type the resource name to find it.
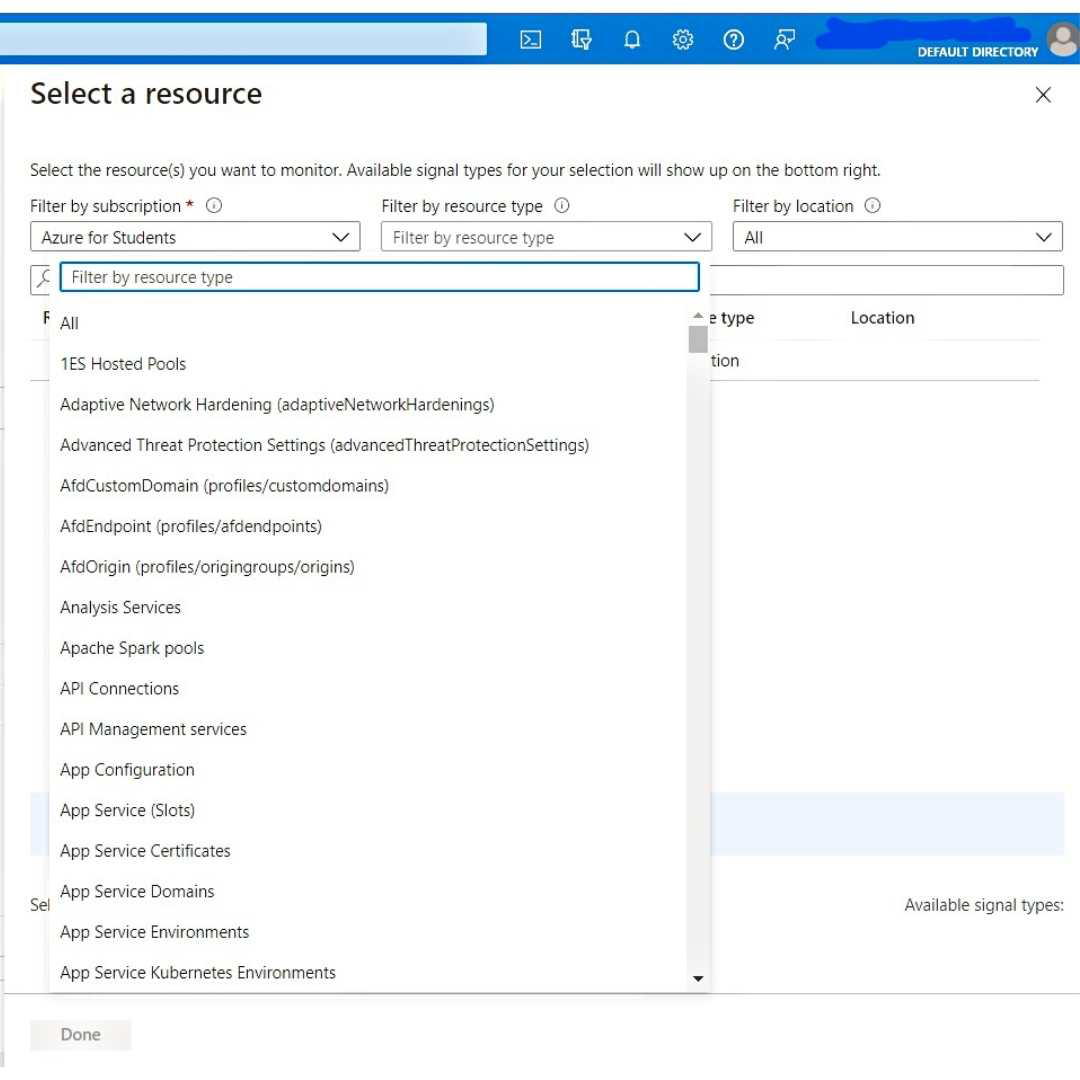
- If the selected target resource has metrics we can create alerts on then available signals on the bottom right will include those metrics. This helps in choosing the right target resource as per our needs.
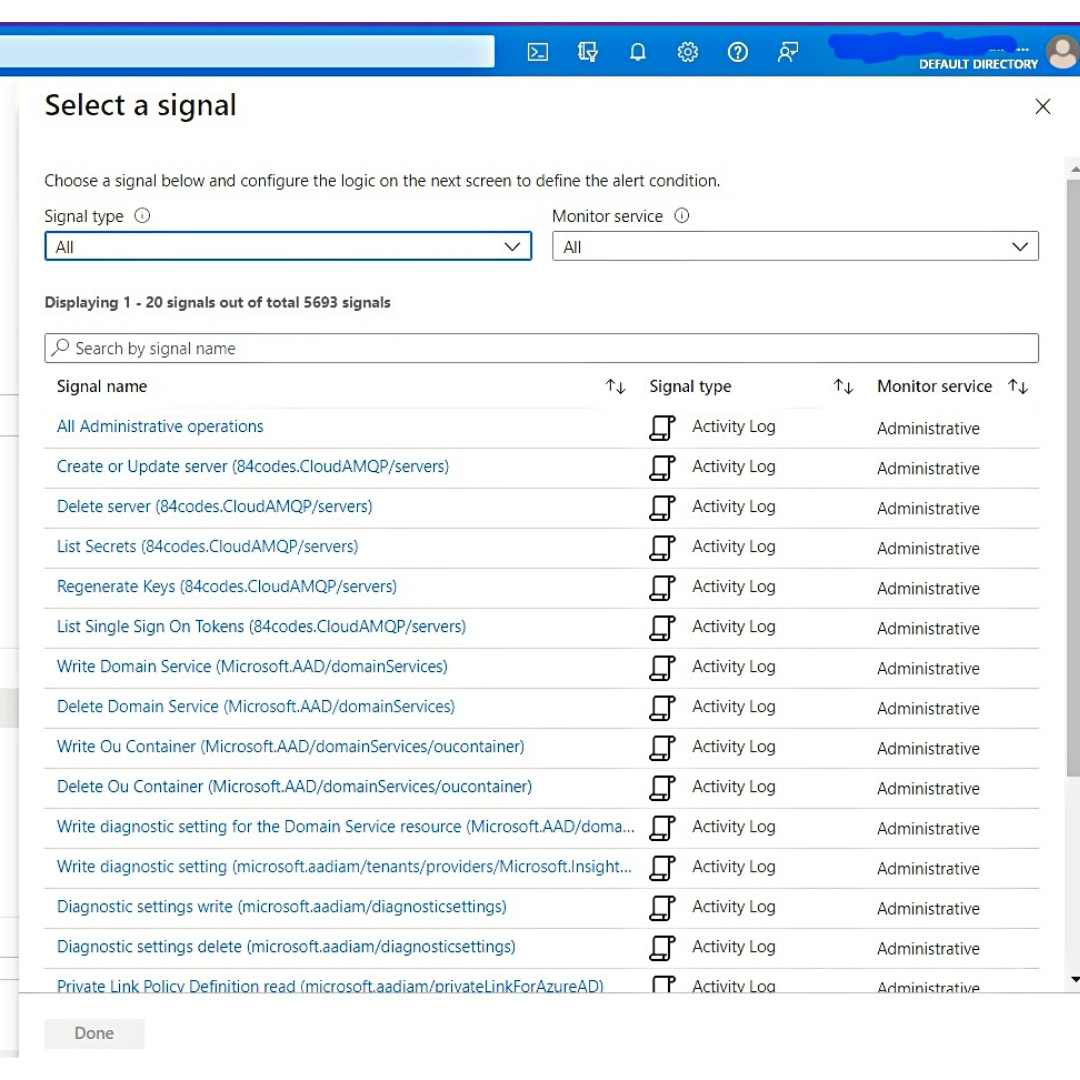
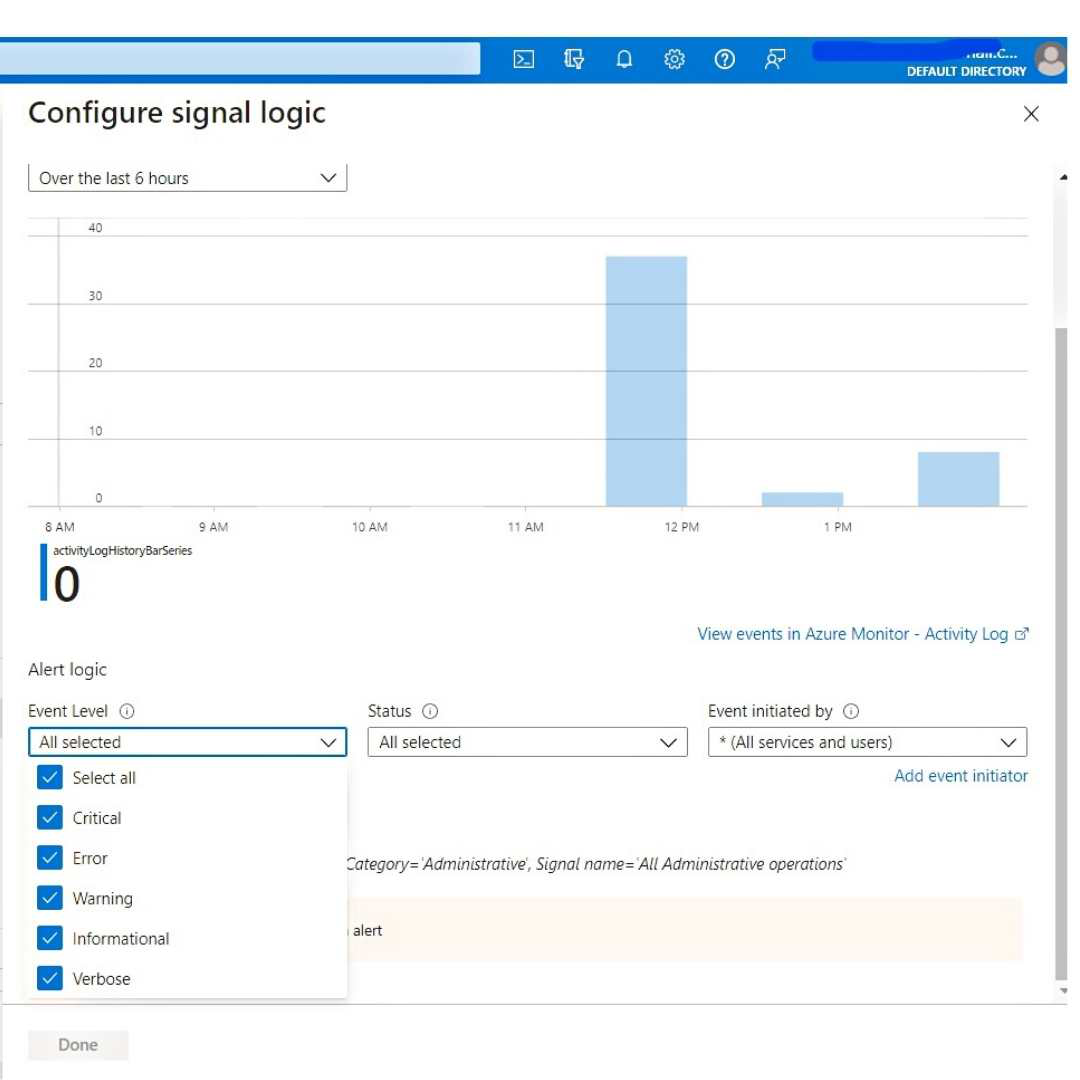
- Once we have selected a target resource, click on the Add condition option to see a list of signals supported for the resource ( signals are of the following types: metric, activity log, Application Insights, and log). Select the metric we wish to create an alert on.
- It will be default display a chart for the chosen metric of the target resource for the last six hours. If we wish to see a long history for the metric, we can use the chart period dropdown.
- Finally determine the logic that the metric alert rule will evaluate and get triggered by selecting the threshold type, operator, and aggregation type, threshold value/sensitivity based on the threshold type chosen.
- Optionally, we can refine the alert condition more by adjusting other conditions like aggregation granularity and frequency of evaluation and then click on Done.
- Optionally, we can add another criterion if we want to monitor a complex alert rule.
- Fill in Alert details like alert rule name, description, and severity. Finally, Add an action group to the alert either by selecting an existing action group or creating a new action group which will define a specific action to be taken when the alert is fired.
- Click Done to save the metric alert rule.
Your metric alert is ready to use. Now you will be alerted based on the threshold value set by you.
Manage and View the Alert in Azure Portal :
We can manage and view the Alert in Azure Monitor. This is how we can view and edit the created metric alerts:
- On the Azure homepage, click on Monitor.
- Click on Alerts and Manage rules.
- In the Manage rules section, we can then view all our existing alert rules across subscriptions. We can further filter the rules using resource group, resource type, and resource.
- Click on the name of the metric alert rule we wish to edit.
- We can view our alert policy here. If we wish to edit a rule, click on the alert criteria we want to edit. We can then change the metric, threshold condition, and other fields as required except the alert rule name.
- Click Done to save the edits.
Congratulations! With a few steps, you learned what Azure Monitor, metric alerts are and how to use Azure monitor to create custom alerts.
We can also create metric alerts using :
- Azure CLI
- Azure Powershell
- Rest API
- Azure Resource Manager Templates
Like Article
Suggest improvement
Share your thoughts in the comments
Please Login to comment...