Mesh Surface Plot in MATLAB
Last Updated :
30 May, 2021
Mesh Surface Plot is used to depict f(X, Y, Z) in a three-dimensional space. Matlab allows users to create mesh surface plots using the mesh() method.
Different syntax of mesh() method are:
- Mesh(X, Y, Z)
- Mesh(Z)
- Mesh(___,C)
- Mesh(___, Name, Value)
- S = mesh()
- Mesh(ax,____)
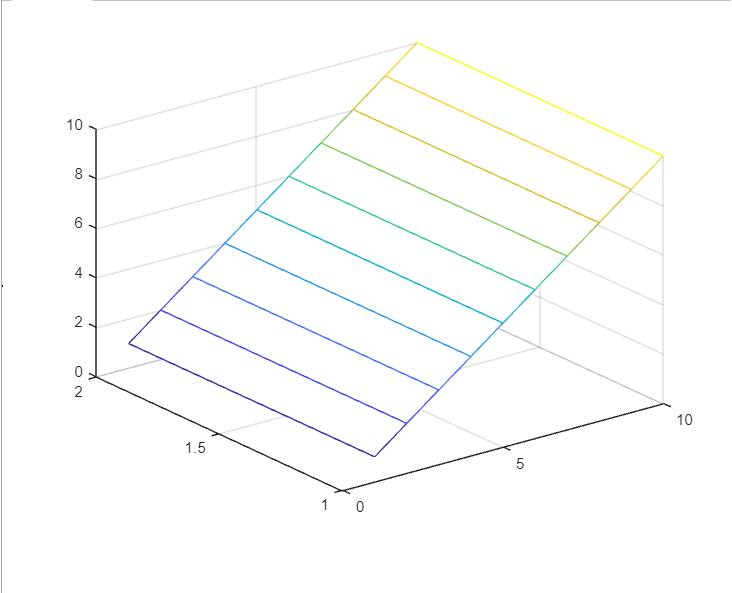
Mesh(X, Y, Z)
- It plots X, Y, Z on a three-dimensional surface.
- Matrices X, Y are plotted along the x-y plane and plots matrix Z as height above the x-y plane.
- If size(Z) = [m, n], then X should be of the same size as Z or a vector of size n.
- Y should be the same size as Z or a vector of size m.
Example:
Matlab
Z = [1:10;
1:10];
Y = [1 2];
X = [1:10];
mesh(X,Y,Z)
|
Output :
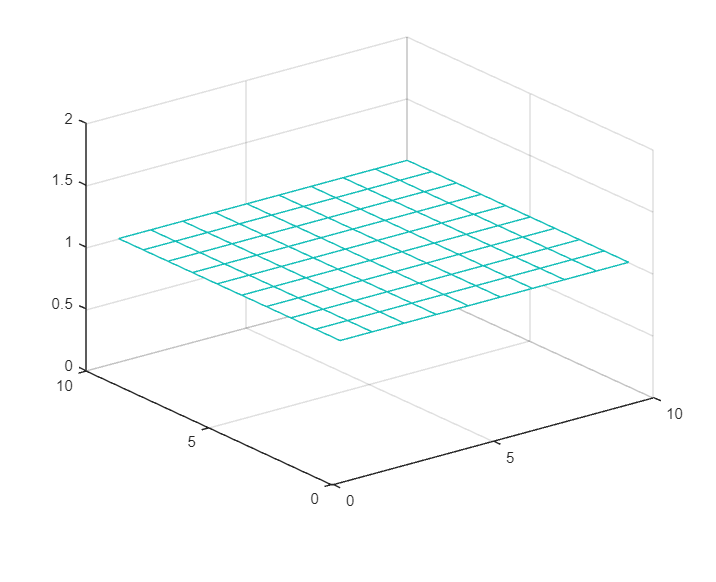
Mesh(Z)
It creates a mesh surface plot with matrix Z by considering column and row indices as x and y-coordinates respectively.
Example:
Output :
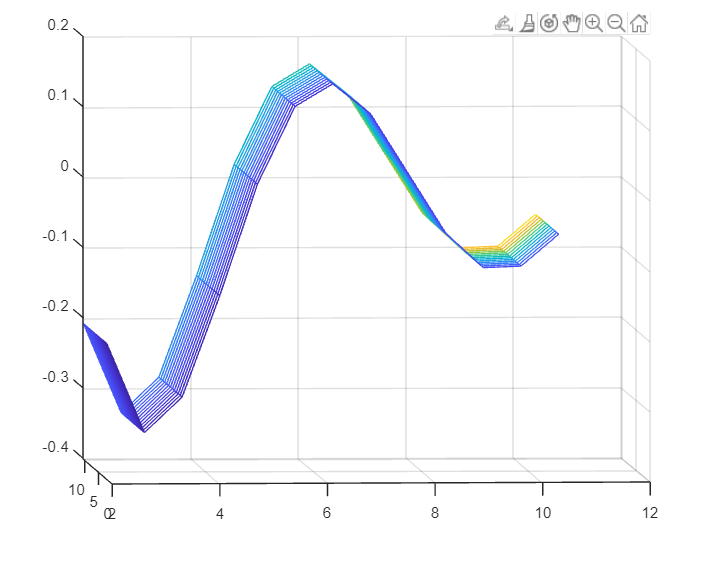
Mesh(___, C)
- It creates a mesh surface plot with the specified color of edges as C.
- C is an m-by-n-by-3 of RGB array where Z is a matrix of size m-by-n.
Example:
Matlab
[X,Y] = meshgrid(2:.7:11);
Z = cos(X)./X;
C = X.*Y;
mesh(X,Y,Z,C)
|
Output :
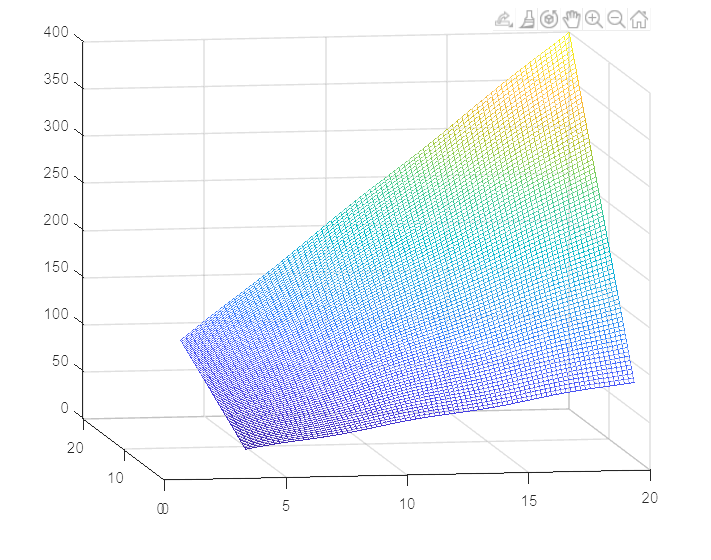
Mesh(___, Name, Value)
- It creates a mesh surface plot with the specified Name-Value pair arguments.
- Some properties are Face Alpha, Edge Color, Line Style etc.
Example:
Matlab
[X,Y] = meshgrid(4:.2:20);
Z = X.*Y - sin(X);
mesh(X,Y,Z,'FaceAlpha','0.5','EdgeColor','flat')
|
Output :
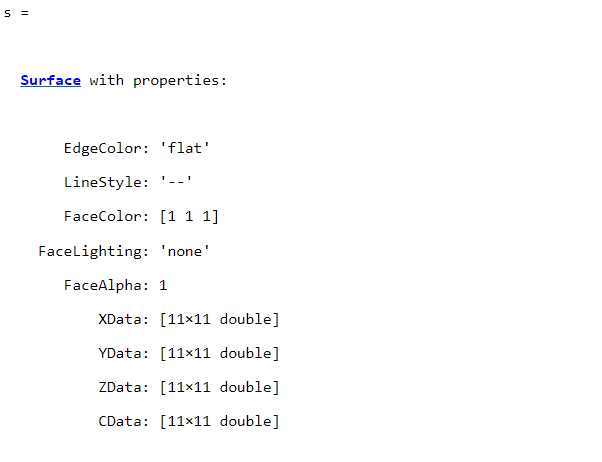
S = mesh(___)
- It creates a mesh plot with specified variables and returns the chart surface objects of the mesh plot.
- You can modify the mesh plot even after creating the plot using the variables.
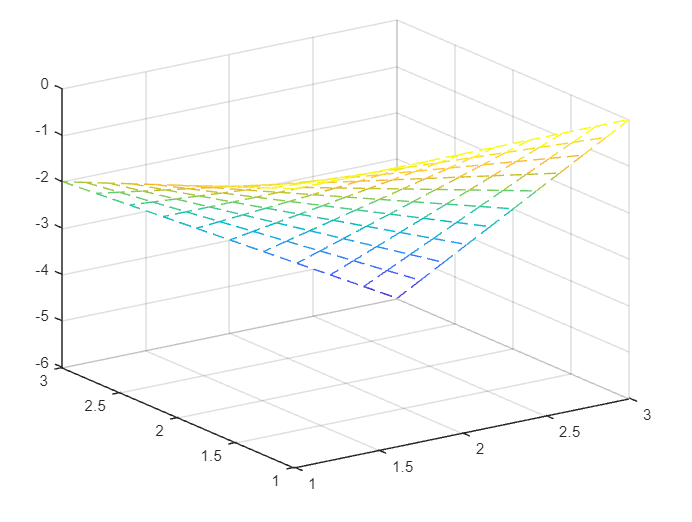
Example 1:
Matlab
[X,Y] = meshgrid(1:.2:3);
Z = X - Y.*X;
s = mesh(X,Y,Z,"LineStyle",'--')
|
Output :
Properties of mesh plot :
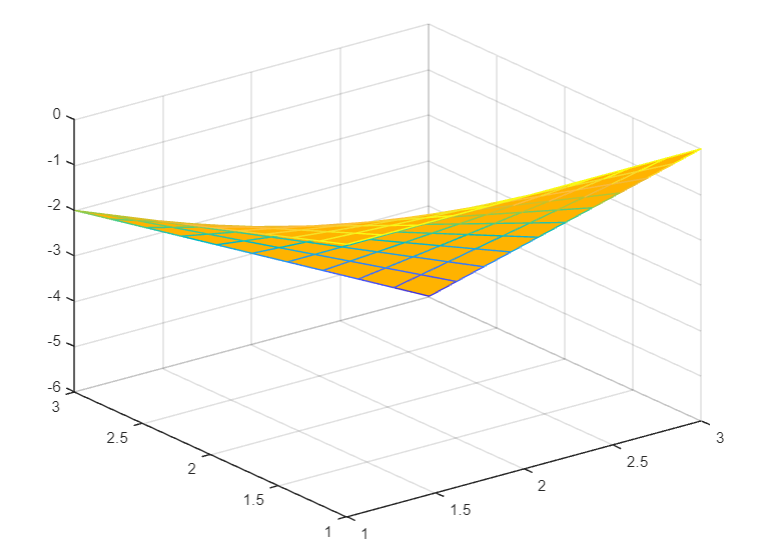
Example 2:
Matlab
[X,Y] = meshgrid(1:.2:3);
Z = X - Y.*X;
s = mesh(X,Y,Z)
s.LineStyle = '-';
s.FaceColor = '[1 0.7 0]'
|
Output :
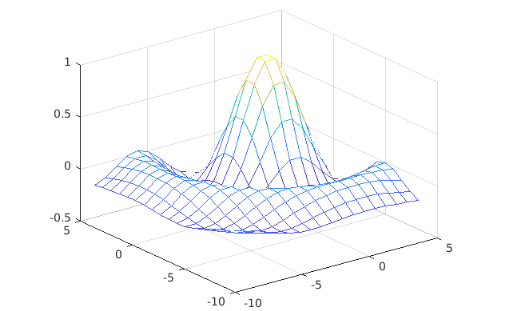
Mesh(ax,______)
This function is used to specify axes in the mesh plot instead of current axes.
Matlab
[X,Y] = meshgrid(-10:.8:4);
R = sqrt(X.^2 + Y.^2) + eps;
Z = sin(R)./R;
mesh(axes,X,Y,Z)
|
Output:
Like Article
Suggest improvement
Share your thoughts in the comments
Please Login to comment...