Mean, Median and Mode in R Programming
Last Updated :
06 Jun, 2023
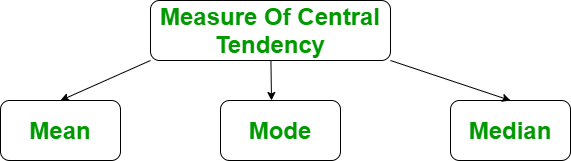
The measure of central tendency in R Language represents the whole set of data by a single value. It gives us the location of the central points. There are three main measures of central tendency:
Mean, Median and Mode in R Programming
Prerequisite:
Before doing any computation, first of all, we need to prepare our data and save our data in external .txt or .csv files and it’s a best practice to save the file in the current directory. After that import, your data into R as follow:
Get the CSV file here.
R
myData = read.csv("CardioGoodFitness.csv",
stringsAsFactors=F)
print(head(myData))
|
Output:
   Product Age Gender Education MaritalStatus Usage Fitness Income Miles
1   TM195  18   Male        14        Single     3       4  29562   112
2   TM195  19   Male        15        Single     2       3  31836    75
3   TM195  19 Female        14     Partnered     4       3  30699    66
4   TM195  19   Male        12        Single     3       3  32973    85
5   TM195  20   Male        13     Partnered     4       2  35247    47
6   TM195  20 Female        14     Partnered     3       3  32973    66
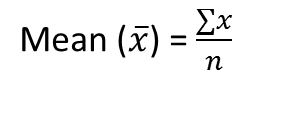
Mean in R Programming Language
It is the sum of observations divided by the total number of observations. It is also defined as average which is the sum divided by count.
Mean, Median and Mode in R Programming
Where, n = number of terms
Example:
R
myData = read.csv("CardioGoodFitness.csv",
stringsAsFactors=F)
mean = mean(myData$Age)
print(mean)
|
Output:
[1] 28.78889
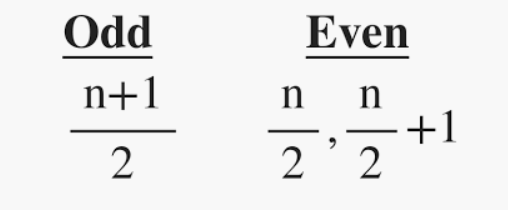
Median in R Programming Language
It is the middle value of the data set. It splits the data into two halves. If the number of elements in the data set is odd then the center element is median and if it is even then the median would be the average of two central elements.
Mean, Median and Mode in R Programming
Where n = number of terms
Syntax: median(x, na.rm = False)
Where, X is a vector and na.rm is used to remove missing value
Example:
R
myData = read.csv("CardioGoodFitness.csv",
stringsAsFactors=F)
median = median(myData$Age)
print(median)
|
Output:
[1] 26
Mode in R Programming Language
It is the value that has the highest frequency in the given data set. The data set may have no mode if the frequency of all data points is the same. Also, we can have more than one mode if we encounter two or more data points having the same frequency. There is no inbuilt function for finding mode in R, so we can create our own function for finding the mode or we can use the package called modeest.
Creating a user-defined function for finding Mode
There is no in-built function for finding mode in R. So let’s create a user-defined function that will return the mode of the data passed. We will be using the table() method for this as it creates a categorical representation of data with the variable names and the frequency in the form of a table. We will sort the column Age column in descending order and will return the 1 value from the sorted values.
Example: Finding mode by sorting the column of the data frame
R
myData = read.csv("CardioGoodFitness.csv",
stringsAsFactors=F)
mode = function(){
return(sort(-table(myData$Age))[1])
}
mode()
|
Output:
25: -25
Using Modeest Package
We can use the modeest package of the R. This package provides methods to find the mode of the univariate data and the mode of the usual probability distribution.
Example:
R
library(modeest)
myData = read.csv("CardioGoodFitness.csv",
stringsAsFactors=F)
mode = mfv(myData$Age)
print(mode)
|
Output:
[1] 25
Mean and median in R for null values
When dealing with null values, you can still calculate the mean and median in R by specifying the appropriate argument to the functions. Here’s an example:
Let’s start by creating a vector with null values:
R
x <- c(1, 2, NA, 4, 5, NA, 7, 8, NA, 9, 10)
mean(x, na.rm = TRUE)
median(x, na.rm = TRUE)
|
Output:
[1] 5.75
[1] 6
The arithmetic mean (average) of the non-missing numbers in x is determined by the function mean(x, na.rm = TRUE). Any NA values in x are ensured to be omitted from the calculation by the na.rm = TRUE option.
Adding up all the non-missing data is the first step in calculating the mean of x.
This function, median(x, na.rm = TRUE), finds the median of the non-missing values in x. Any NA values in x are ensured to be omitted from the calculation by the na.rm = TRUE option.
Share your thoughts in the comments
Please Login to comment...