Matplotlib.ticker.FuncFormatter class in Python
Last Updated :
07 Oct, 2021
Matplotlib is an amazing visualization library in Python for 2D plots of arrays. Matplotlib is a multi-platform data visualization library built on NumPy arrays and designed to work with the broader SciPy stack.
matplotlib.ticker.FuncFormatter
The matplotlib.ticker.FuncFormatter class uses a user defined function for formatting. This user defined function must take two values as inputs for a tick value x and a position pos.
Syntax: class matplotlib.ticker.FuncFormatter(func)
Parameter:
- func: The user defined function for formatting of the plot.
Example 1:
Python3
import matplotlib.pyplot as plt
import matplotlib.ticker as tick
import numpy as np
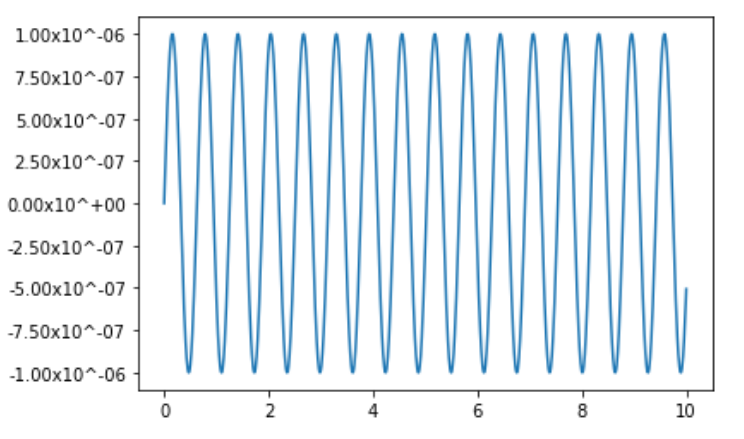
x = np.linspace(0, 10, 1000)
y = 0.000001 * np.sin(10 * x)
fig = plt.figure()
ax = fig.add_subplot(111)
ax.plot(x, y)
def y_fmt(x, y):
return '{:2.2e}'.format(x).replace('e', 'x10^')
ax.yaxis.set_major_formatter(tick.FuncFormatter(y_fmt))
plt.show()
|
Output:
Example 2:
Python3
import matplotlib.pyplot as plt
from matplotlib.ticker import FuncFormatter
fig, ax = plt.subplots()
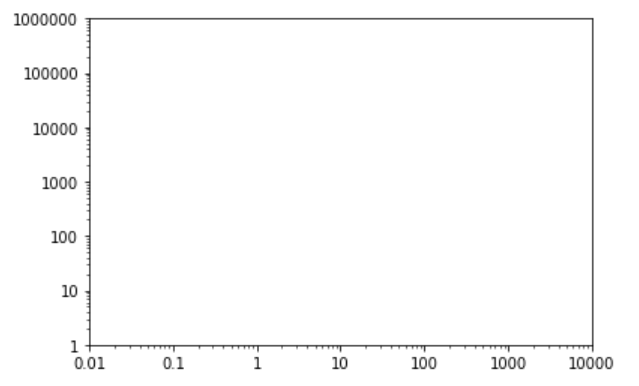
ax.axis([0.01, 10000, 1, 1000000])
ax.loglog()
for axis in [ax.xaxis, ax.yaxis]:
formatter = FuncFormatter(lambda y, _: '{:.16g}'.format(y))
axis.set_major_formatter(formatter)
plt.show()
|
Output:
Like Article
Suggest improvement
Share your thoughts in the comments
Please Login to comment...