Matplotlib.pyplot.yticks() in Python
Last Updated :
12 Apr, 2020
Matplotlib is a library in Python and it is numerical – mathematical extension for NumPy library. Pyplot is a state-based interface to a Matplotlib module which provides a MATLAB-like interface.
Matplotlib.pyplot.yticks() Function
The annotate() function in pyplot module of matplotlib library is used to get and set the current tick locations and labels of the y-axis.
Syntax: matplotlib.pyplot.yticks(ticks=None, labels=None, **kwargs)
Parameters: This method accept the following parameters that are described below:
- ticks: This parameter is the list of xtick locations. and an optional parameter. If an empty list is passed as an argument then it will removes all xticks
- labels: This parameter contains labels to place at the given ticks locations. And it is an optional parameter.
- **kwargs: This parameter is Text properties that is used to control the appearance of the labels.
Returns: This returns the following:
- locs :This returns the list of ytick locations.
- labels :This returns the list of ylabel Text objects.
The resultant is (locs, labels)
Below examples illustrate the matplotlib.pyplot.yticks() function in matplotlib.pyplot:
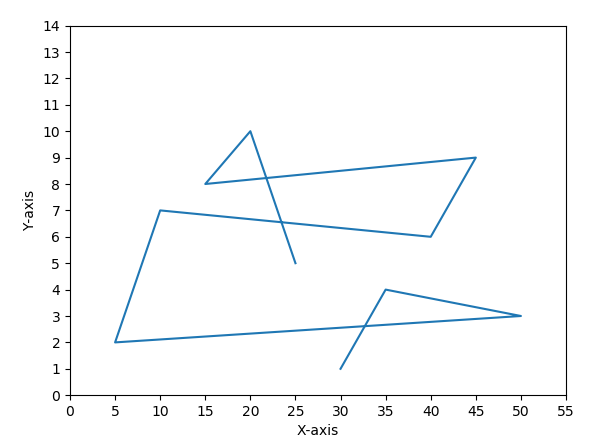
Example #1:
import numpy as np
import matplotlib.pyplot as plt
valx = [30, 35, 50, 5, 10, 40, 45, 15, 20, 25]
valy = [1, 4, 3, 2, 7, 6, 9, 8, 10, 5]
plt.plot(valx, valy)
plt.xlabel('X-axis')
plt.ylabel('Y-axis')
plt.xticks(np.arange(0, 60, 5))
plt.yticks(np.arange(0, 15, 1))
plt.show()
|
Output:
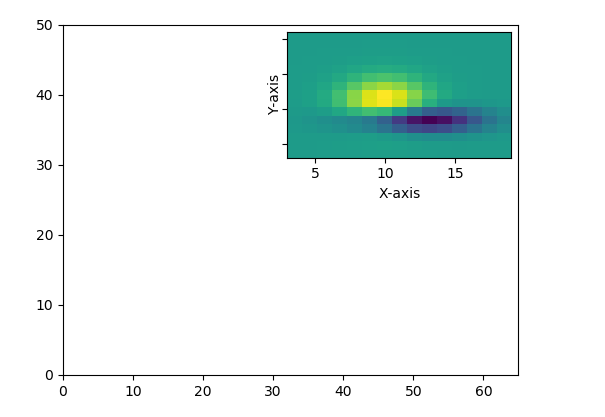
Example #2:
import matplotlib.pyplot as plt
from mpl_toolkits.axes_grid1.inset_locator import inset_axes, zoomed_inset_axes
def get_demo_image():
from matplotlib.cbook import get_sample_data
import numpy as np
f = get_sample_data("axes_grid/bivariate_normal.npy",
asfileobj=False)
z = np.load(f)
return z, (3, 19, 4, 13)
fig, ax = plt.subplots(figsize=[5, 4])
Z, extent = get_demo_image()
ax.set(aspect=1,
xlim=(0, 65),
ylim=(0, 50))
axins = zoomed_inset_axes(ax, zoom=2, loc='upper right')
im = axins.imshow(Z, extent=extent, interpolation="nearest",
origin="upper")
plt.xlabel('X-axis')
plt.ylabel('Y-axis')
plt.yticks(visible=False)
plt.show()
|
Output:
Share your thoughts in the comments
Please Login to comment...