Matplotlib.pyplot.vlines() in Python
Last Updated :
18 Nov, 2021
Matplotlib is a plotting library for creating static, animated, and interactive visualizations in Python.
Matplotlib.pyplot.vlines()
matplotlib.pyplot.vlines() is a function used in the plotting of a dataset. In matplotlib.pyplot.vlines(), vlines is the abbreviation for vertical lines.what this function does is very much clear from the expanded form, which says that function deals with the plotting of the vertical lines across the axes.
Syntax: vlines(x, ymin, ymax, colors, linestyles)
Example 1:
Python3
import numpy as np
import matplotlib.pyplot as plt
plt.vlines(4, 0, 5, linestyles ="dotted", colors ="k")
plt.vlines(3, 0, 5, linestyles ="solid", colors ="k")
plt.vlines(5, 0, 5, linestyles ="dashed", colors ="k")
plt.xlim(0, 10)
plt.ylim(0, 10)
plt.show()
|
Output :
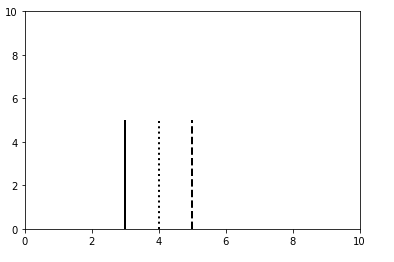
In the above example, the first argument at the beginning of the vlines() function shows the axis-point at the vertical line is to be generated, the next argument refers to the lower limit of the total length of the vertical line, whereas the third argument refers to the upper limit of the total length of the vertical line. After these three basic arguments, the next argument we can use is linestyles which decides the type of line to be plotted (eg.dotted, solid, dashed, dashdot, etc.), the last argument used is colors which is optional, basically, it is array-like of colors.
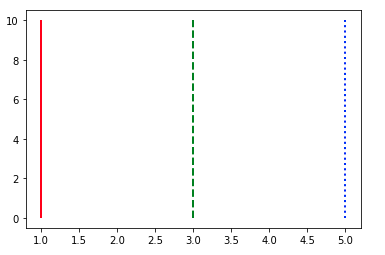
Example 2:
Python3
import matplotlib.pyplot as plt
plt.vlines((1, 3, 5,), 0, 10, colors = ("r", "g", "b"),
linestyles = ("solid", "dashed", "dotted"))
plt.show()
|
Output:
Like Article
Suggest improvement
Share your thoughts in the comments
Please Login to comment...