Matplotlib.pyplot.tick_params() in Python
Last Updated :
19 Apr, 2020
Matplotlib is a visualization library in Python for 2D plots of arrays. Matplotlib is a multi-platform data visualization library built on NumPy arrays and designed to work with the broader SciPy stack.
matplotlib.pyplot.tick_params()
matplotlib.pyplot.tick_params() is used to change the appearance of ticks, tick labels, and gridlines.
Syntax:
matplotlib.pyplot.tick_params(axis='both', **kwargs)
Parameters :
| Parameter |
Value |
Use |
| axis |
{‘x’, ‘y’, ‘both’}, optional |
Which axis to apply the parameters to. Default is ‘both’. |
| reset |
bool, default: False |
If True, set all parameters to defaults before processing other keyword arguments.. |
| which |
{‘major’, ‘minor’, ‘both’} |
Default is ‘major’; apply arguments to which ticks. |
| direction |
{‘in’, ‘out’, ‘inout’} |
Puts ticks inside the axes, outside the axes, or both. |
| length |
float |
Tick length in points. |
| width |
float |
Default is ‘major’; apply arguments to which ticks. |
| color |
color |
Tick color. |
| pad |
float |
Distance in points between tick and label. |
labelsize |
float or str |
Tick label font size in points or as a string (e.g., ‘large’). |
labelcolor |
color |
Tick label color. |
colors |
color |
Tick color and label color. |
zorder |
float |
Tick and label zorder. |
bottom, top, left, right |
bool |
Whether to draw the respective ticks. |
labelbottom, labeltop, labelleft, labelright |
bool |
Whether to draw the respective tick labels. |
labelrotation |
float |
Tick label rotation |
grid_color |
color |
Gridline color |
grid_alpha |
float |
Transparency of gridlines: 0 (transparent) to 1 (opaque). |
grid_linewidth |
float |
Width of gridlines in points. |
grid_linestyle |
str |
Any valid Line2D line style spec. |
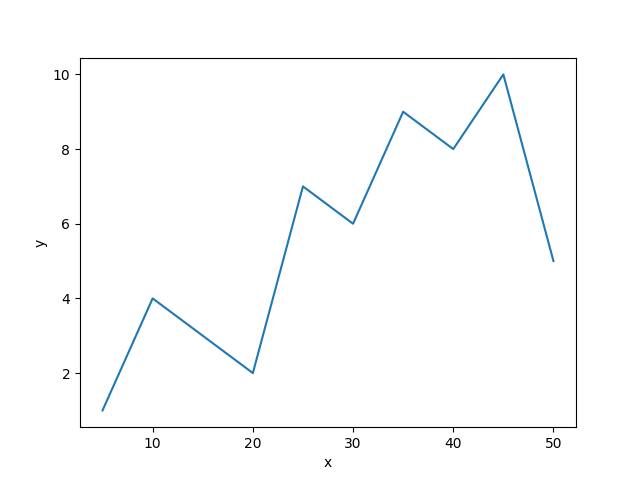
Example #1: Default plot
import matplotlib.pyplot as plt
x = [i for i in range(5, 55, 5)]
y = [1, 4, 3, 2, 7, 6, 9, 8, 10, 5]
plt.plot(x, y)
plt.xlabel('x')
plt.ylabel('y')
plt.show()
|
Output :
Example #2:
import matplotlib.pyplot as plt
from matplotlib.ticker import MultipleLocator, ScalarFormatter
fig, ax = plt.subplots()
ax.plot([0, 10, 20, 30], [0, 2, 1, 2])
ax.xaxis.set_minor_locator(MultipleLocator(1))
ax.xaxis.set_minor_formatter(ScalarFormatter())
ax.tick_params(axis ='both', which ='major',
labelsize = 16, pad = 12,
colors ='r')
ax.tick_params(axis ='both', which ='minor',
labelsize = 8, colors ='b')
plt.show()
|
Output:

Like Article
Suggest improvement
Share your thoughts in the comments
Please Login to comment...