Matplotlib.pyplot.text() function in Python
Last Updated :
25 Nov, 2020
This function is used to add a text to the axes at location x, y in data coordinates.
Syntax: matplotlib.pyplot.text(x, y, s, fontdict=None, **kwargs)
| parameters |
Description |
| x, y:float |
The position to place the text. By default, this is in data coordinates. The coordinate system can be changed using the transform parameter. |
| s :str |
The text. |
| fontdict : dict default none |
A dictionary to override the default text properties. If fontdict is None, the defaults are determined by rcParams. |
| **kwargs |
Text properties. |
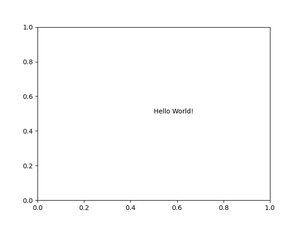
Example #1: Text on plot sheet
Python3
import matplotlib.pyplot
matplotlib.pyplot.text(0.5, 0.5, "Hello World!")
matplotlib.pyplot.savefig("out.png")
|
Output:
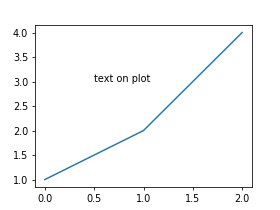
Example #2: Add text to a plot
Python3
import matplotlib.pyplot as plt
w = 4
h = 3
d = 70
plt.figure(figsize=(w, h), dpi=d)
x = [1, 2, 4]
x_pos = 0.5
y_pos = 3
plt.text(x_pos, y_pos, "text on plot")
plt.plot(x)
plt.savefig("out.png")
|
Output:
Like Article
Suggest improvement
Share your thoughts in the comments
Please Login to comment...