Matplotlib.pyplot.subplot() function in Python
Last Updated :
20 May, 2022
Prerequisites: matplotlib
subplot() function adds subplot to a current figure at the specified grid position. It is similar to the subplots() function however unlike subplots() it adds one subplot at a time. So to create multiple plots you will need several lines of code with the subplot() function. Another drawback of the subplot function is that it deletes the preexisting plot on your figure. Refer to example 1.
It is a wrapper of Figure.add_subplot.
Syntax:
subplot(nrows, ncols, index, **kwargs)
subplot(pos, **kwargs)
subplot(ax)
Parameters :
- args: Either a 3-digit integer or three separate integers describing the position of the subplot.
- pos is a three-digit integer where the first, second, and third integer are nrows,ncols, index.
- projection : [{None, ’aitoff’, ’hammer’, ’lambert’, ’mollweide’, ’polar’, ’rectilinear’, str}, optional]. The projection-type of the subplot (Axes). The default None results in a ’rectilinear’ projection.
- label : [str] A label for the returned axes.
- **kwargs: This method also takes the keyword arguments for the returned axes base class;
except for the figure argument, for e.g facecolor.
Returns : An axes.SubplotBase subclass of Axes or a subclass of Axes. The returned axes base class depends on the projection used.
Implementation of the function is given below:
Example 1: subplot() will delete the pre-existing plot.
Python3
import matplotlib.pyplot as plt
x = [1, 2, 3, 4, 5]
y = [1, 2, 1, 2, 1]
plt.plot(x, y, marker="x", color="green")
plt.subplot(121)
|
Output: We can see that the first plot got set aside by the subplot() function.
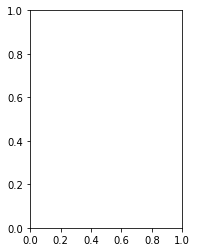
subplot_gfg
If you want to see the first plot comment out plt.subplot() line and you will see the following plot
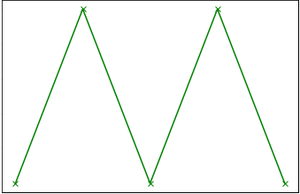
plot_gfg
Example 2:
Python3
import matplotlib.pyplot as plt
x = [3, 1, 3]
y = [3, 2, 1]
z = [1, 3, 1]
plt.figure()
plt.subplot(121)
plt.plot(x, y, color="orange", marker="*")
plt.subplot(122)
plt.plot(z, y, color="yellow", marker="*")
|
Output :
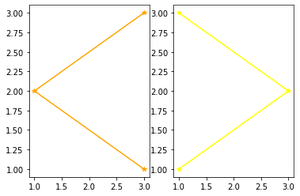
multiple_subplots
Like Article
Suggest improvement
Share your thoughts in the comments
Please Login to comment...