matplotlib.pyplot.step() function in Python
Last Updated :
14 Aug, 2020
The step() function designs the plot such that, it has a horizontal baseline to which the data points will be connected by vertical lines. This kind of plot is used to analyze at which points the change in Y-axis value has occurred exactly with respect to X-axis. This is very useful in discrete analysis. The step plotting can be combined with any other plots. The occurrence of steps can also be formatted by supplying appropriate parameter values. The parameters for this function are tabulated below.
|
Parameters
|
Description
|
|
x
|
an 1-D array of values. |
|
y
|
an 1-D array of values. |
|
fmt
|
Formatting strings that specify line color, marker type ,etc,. |
|
data
|
Two iterables containing the label names for labelled data. |
|
where
|
To decide the position of the vertical line. (values : pre|post|mid) |
Note: The parameters ‘fmt’, ‘data’, ‘where’ are optional.
‘where’ parameter
The where parameter is used to denote at which place the vertical line should connect the data point to the horizontal base line. It decides where to place the step like visualization. To be more clear, this parameter decides where the Y-value should be constantly drawing a horizontal line. It can take any one among the three values which are explained below with examples.
First, consider two arrays that are to be plotted :
x = [1,3,4,5,7]
y = [1,9,16,25,49]
The array x contains some integers and the array y contains the squares of the numbers in the corresponding index in x. If these values are simply plotted without any step function one gets a straight line plotted in the graph as given below.
Python3
import matplotlib.pyplot as plt
import numpy as np
x = np.array([1, 3, 4, 5, 7])
y = np.array([1, 9, 16, 25, 49])
plt.plot(x, y)
plt.show()
|
Output:
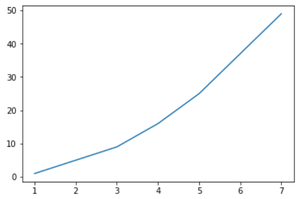
a plot without steps
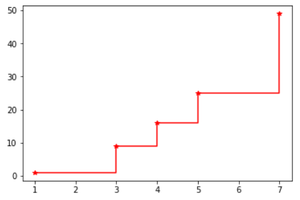
pre : The Y-value remains constant to the left of the data point. For example the value y[i] remains constant between x[i-1] and x[i]. The plot with step for the same one plotted above is given below. In the code below, ‘g^’ denotes the line color is green and the marker should be an upward triangle.
Python3
import matplotlib.pyplot as plt
import numpy as np
x = np.array([1, 3, 4, 5, 7])
y = np.array([1, 9, 16, 25, 49])
plt.step(x, y, 'g^', where='pre')
plt.show()
|
Output:

where=’pre’
In the image above you can see the horizontal lines to the left of the data points which are marked by small green triangles. For example, x[0] is 1 and its corresponding y-value is 1. The next value x[1] is 3 and the y-value is 9. Now you can see a constant line in 9 from 1. The vertical line shoots up once the data point 3 is reached in the X-axis. To be more clear, look at the image with highlighted portions, given below.

horizontal lines in range x[i-1] and x[i]
- post: The Y-value remains constant to the right of the data point. For example the value y[i] remains constant between x[i] and x[i+1]. The plot with step for the same one plotted above is given below. In the code below, ‘r*’ denotes the line color is red and the marker should be an asterisk (“*“).
Python3
import matplotlib.pyplot as plt
import numpy as np
x = np.array([1, 3, 4, 5, 7])
y = np.array([1, 9, 16, 25, 49])
plt.step(x, y, 'r*', where='post')
plt.show()
|
Output:
where=’post’
Look at the highlighted portions to view the difference between the values ‘pre‘ and ‘post‘.
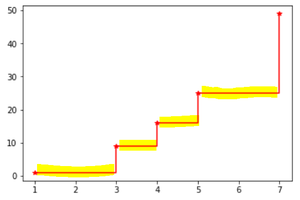
horizontal lines in range x[i] and x[i+1]
- mid: The vertical line shoots up at a value (x[i-1] and x[i+1])/2. The plot with step for the same one plotted above is given below. In the code below, ‘cs’ denotes the line color is red and the marker should be a square.
Python3
import matplotlib.pyplot as plt
import numpy as np
x = np.array([1, 3, 4, 5, 7])
y = np.array([1, 9, 16, 25, 49])
plt.step(x, y, 'cs', where='mid')
plt.xlim(1, 9)
plt.show()
|
Output:
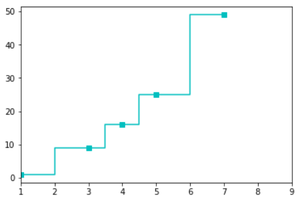
where=’mid’
For better understanding, look at the image below.
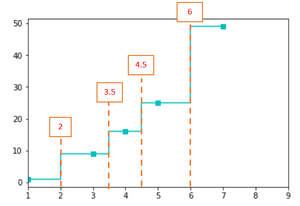
horizontal line in a value (x[i-1] and x[i+1])/2
For example, x[0] is 1, x[1] is 3 and the mid-value is 2. In a similar way, for other values also the mid-value is calculated and the vertical line raises there.
The step() can be combined with other plots also. Look at the example below for the same data points used above.
Python3
import matplotlib.pyplot as plt
import numpy as np
x = np.array([1, 3, 4, 5, 7])
y = np.array([1, 9, 16, 25, 49])
plt.step(x, y, 'ys', where='mid')
plt.xlim(1, 9)
plt.bar(x, y)
plt.show()
|
Output:

In the same way, any plot type can be combined with the step() function.
Like Article
Suggest improvement
Share your thoughts in the comments
Please Login to comment...