Matplotlib.pyplot.savefig() in Python
Last Updated :
26 May, 2020
Matplotlib is highly useful visualization library in Python. It is a multi-platform data visualization library built on NumPy arrays and designed to work with the broader SciPy stack. Visualization plays a very important role as it helps us to understand huge chunks of data and extract knowledge.
Matplotlib.pyplot.savefig()
As the name suggests savefig() method is used to save the figure created after plotting data. The figure created can be saved to our local machines by using this method.
Syntax: savefig(fname, dpi=None, facecolor=’w’, edgecolor=’w’, orientation=’portrait’, papertype=None, format=None, transparent=False, bbox_inches=None, pad_inches=0.1, frameon=None, metadata=None)
Parameters:
| PARAMETERS |
DESCRIPTION |
| fname |
Filename .png for image, .pdf for pdf format.
File location can also be specified here. |
| dpi |
Number of dots per inch.(picture quality) |
| papertype |
Paper type could be “a0 to a10”, “executive”,
“b0 to b10”, “letter”, “legal”, “ledger”. |
| format |
File format such as .png, .pdf. |
| facecolor and edgecolor |
Default as White. |
| bbox_inches |
Set it as “tight” for proper fit of the saved figure. |
| pad_inches |
Padding around the saved figure. |
| transparent |
Makes background of the picture transparent. |
| Orientation |
Landscape or Portrait. |
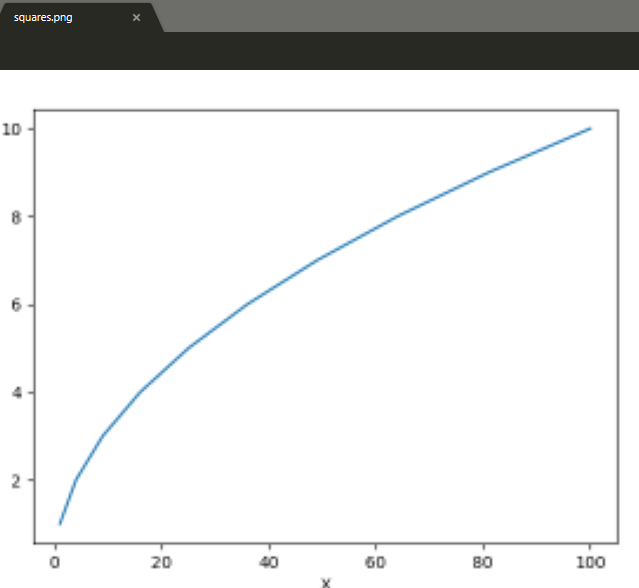
Example 1:
import matplotlib.pyplot as plt
xaxis =[1, 4, 9, 16, 25, 36, 49, 64, 81, 100]
yaxis =[1, 2, 3, 4, 5, 6, 7, 8, 9, 10]
plt.plot(xaxis, yaxis)
plt.xlabel("X")
plt.ylabel("Y")
plt.savefig("squares.png")
plt.show()
|
Output :
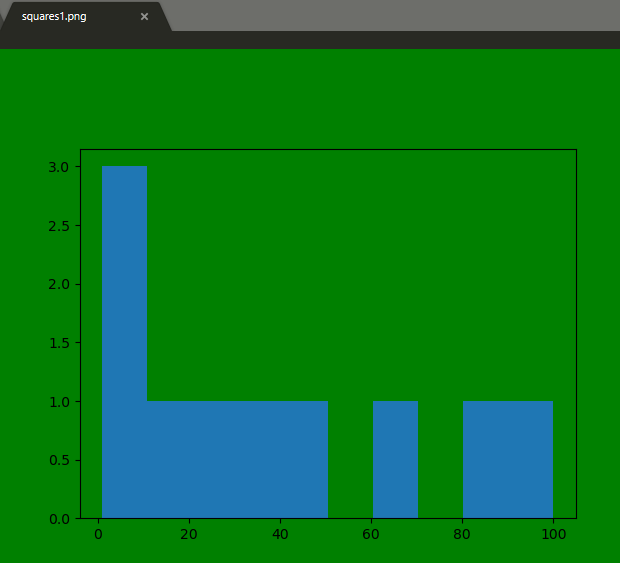
Example 2:
import matplotlib.pyplot as plt
x =[1, 4, 9, 16, 25, 36, 49, 64, 81, 100]
plt.hist(x)
plt.savefig("squares1.png",
bbox_inches ="tight",
pad_inches = 1,
transparent = True,
facecolor ="g",
edgecolor ='w',
orientation ='landscape')
plt.show()
|
Output :
Like Article
Suggest improvement
Share your thoughts in the comments
Please Login to comment...